Price Chart's are a graphical representation of human behaviour at a certain price - Matthew Clark
Our very own Matthew Clark asserted that graphs are a reflection of what an investor is thinking at certain point in time. Price undeniably reflects the collective conscious of all market particpants and is therefore an essential signal to analyze in order to gain a clearer view on the direction of financial markets.
Many books have been written about the nature of markets and the human psychology underpinning them. We can now provably measure this free market behavior in the data held by Bitcoin's ledger.
'On-chain' metrics are indicators of a cryptocurrency's fundamentals. They are produced by extracting data from a cryptocurrency's publically distributed ledger. These are then aggregated to produce several metrics that describe the behaviour of investors. We will be viewing several of these on-chain metrics to help define and analyze market sentiment and predict Bitcoin's price movement.
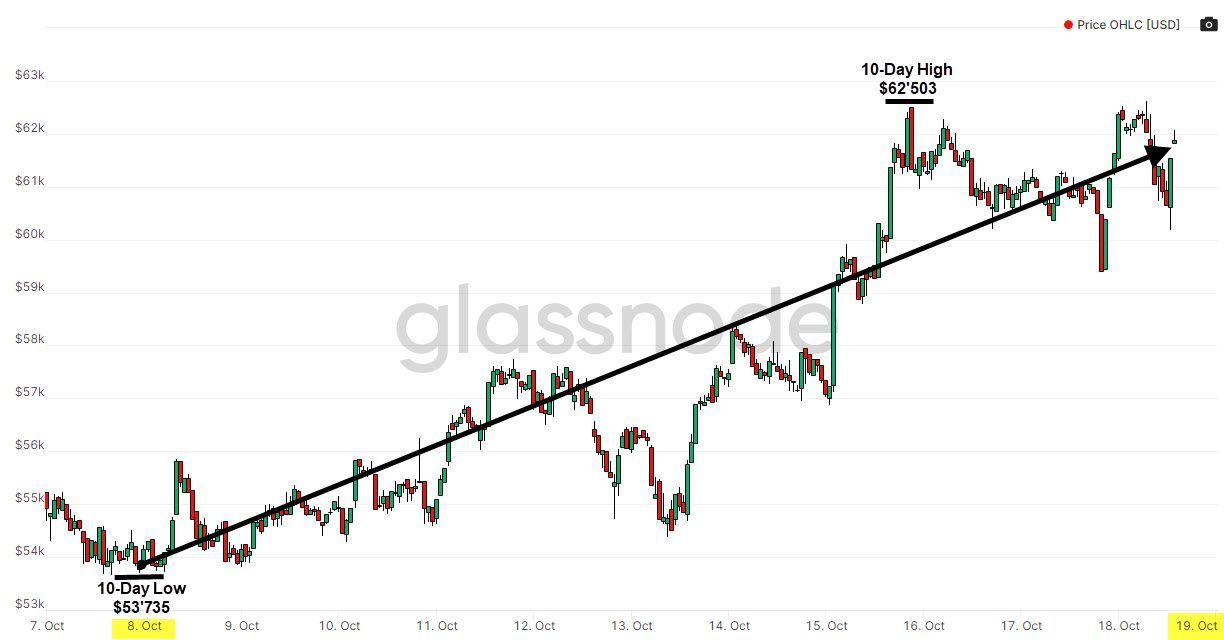
Bitcoin Weekly Price Action
Bitcoin's price reached the symbolic $60k level in the last days and has now erased the losses incurred by the May 2021 sell-off which saw prices plumment by more than 50%. Bitcoin has continued to rally from its September lows ($40k), increasing by more than 12% since the last BTC On-Chain Market Intelligence report. This period saw a slight correction in price from $57.3k to $54.4k, before rallying back up to $62.5k, approximately $2000 shy of its all-time high. Bitcoin is currently trading at $62.2k.
What is current 'Market Sentiment' ?
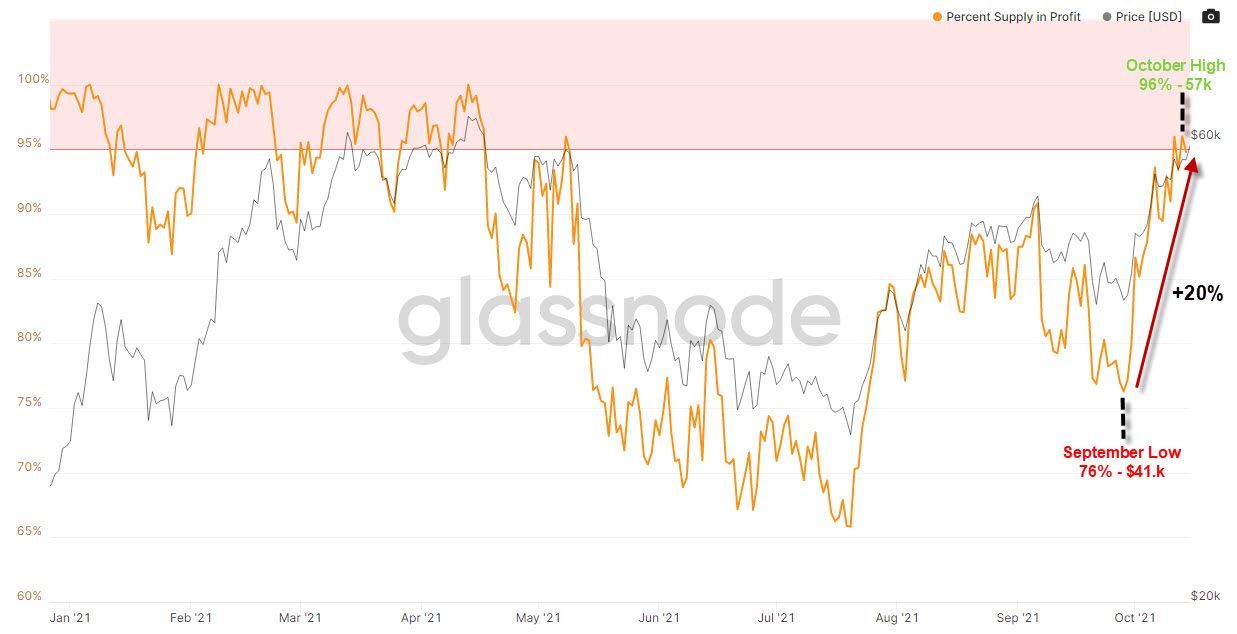
BTC: Percent Supply in Profit
This metric measures the amount of coins that are in profit as a percentage of total supply. As price has rallied out of the September range of $41k-49k, the supply of bitcoin in profit have increased from 76% to 96%. This 20% increase in the supply of coins in profit describes the amount of accumulation that has taken throughout September. Investors with high conviction collected coins to hold for the long term. These same coins now have all moved into profit, which is a testament to the strong demand dynamics in the market, and the positive sentiment within it.
Long & Short-term Holder Supply in Profit / Loss
This metric expresses the percentage of bitcoin supply held by long-term holders (LTHs) and short-term holders (STHs), as well as the ratio that is in profit or loss. The red shades represent coins held by STHs and the blue shades represent coins held by LTHs. The dark shades illustrate coins that are profitable whereas the lighter shade represents those that are at a loss.
November 2019 - July 2020
This period observed bearish price movement as the price of bitcoin was low and relatively stable. We can observe a wide channel of coins held at a loss (long-term & short-term) indicated by the arrows.
August 2020 - December 2020
The channel of coins held at a loss tightened as the price of bitcoin gradually increased. Ensuing bearish price activtiy, the higher the share of coins return to profit, the more positive the sentiment in the market. This leads to more demand and further upward price movement as most of the market is making a return on their investment.
January 2021 - May 2021
As the share of coins in profit reached 99.7%, the channel of coins held at a loss virtually closed shut. This sent prices sky high as bitcoin became an extremely desirable investment as most market participants were making profits. This is manifested by the extended period of time the channel of coins held at a loss was tight.
In terms of market sentiment, LTHs were realizing profits by selling into market strength. This supply was bought up by STHs as can be seen with the increased share of STHs (red) relatively to LTHs (blue) during the Jan '21 to May '21 period.
May 2021 - July 2021
The bull run ended with a steep sell-off in May causing and the sudden reopening of the channel. An increasing share of coins were held at a loss, creating negative market sentiment and more panic selling.
August 2021 - October 2021
As prices recovered from July's low of $29k, we can observed a renewed tightening of the channel of coins held at a loss. More recently, we can observe the squeezing of the channel, as can be seen with the double-sided arrow on the far right.
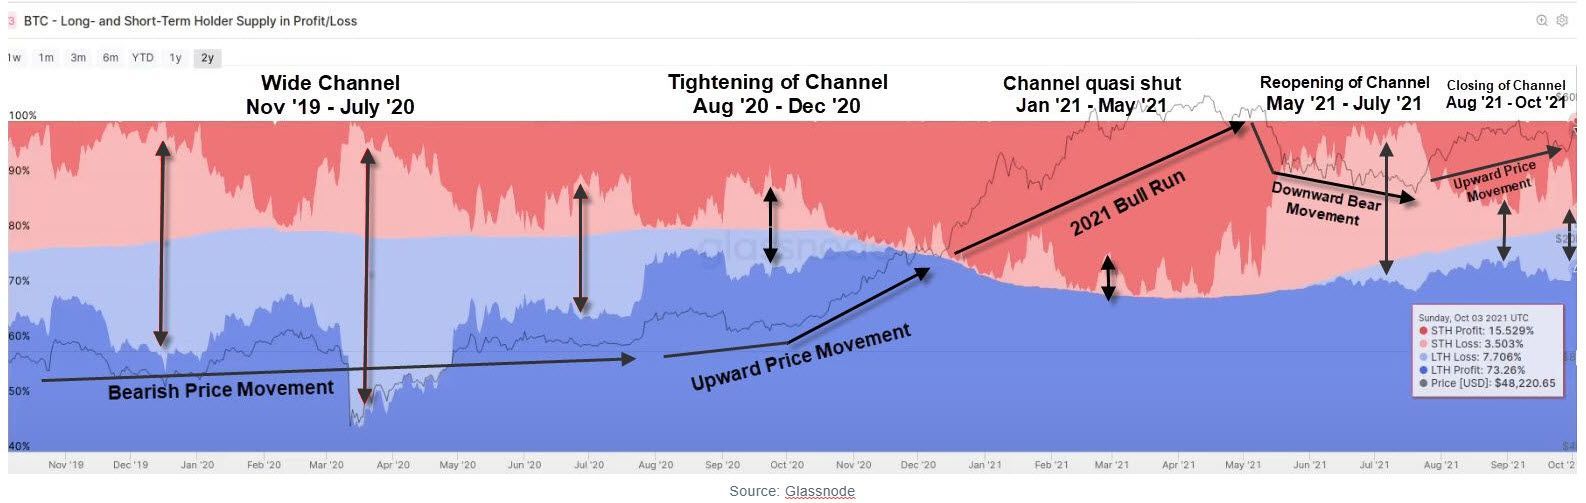
October 2021 - Present
Currently, the channel of coins held at a loss has started to constrict as prices have continued to climb. These dynamics are a good sign for price as a large share of coins are in profit, and market sentiment is therefore positive.
We last observed similar dynamics at the end December of 2020. The channel was tightening, price was rising and market sentiment was positive. These conditions lead to the large bull run that we observed in early 2021. If this pattern holds true therefore, we could expect a similar bull run to occur in the near-future, as the same conditions can be observed.
Its important to consider the following possibilities ahead:
1. LTHs and STHs could start taking profits and therefore chop prices
2. The pattern observed at the end of 2020 could play out, as the channel of coins held at a loss squeezes further as more bitcoins return to profit. This would build positive sentiment and pave the way for more constructive price action and lead bitcoin to new all-time highs.
Net Unrealized Profit / Loss (NUPL)
The NUPL metric enables us to denote the different stages of the market and is a good gauge of market sentiment. It therefore enables us to identify periods of profit taking as well as efficient entry points into the market
The metric looks at how much profit or loss is unrealized as a percentage of market cap. In other words, if the metric is at 0.5 NUPL, 50% of the bitcoin market cap is made up of unrealized profits. Conversely, if the metric is at -0.50 NUPL, 50% of the value of the bitcoin market cap is made up of coins held at a loss.
We can identify certain NUPL ranges that shed light on investor sentiment during a specific stage of the market. Four distinct ranges can be identified in the last two years.
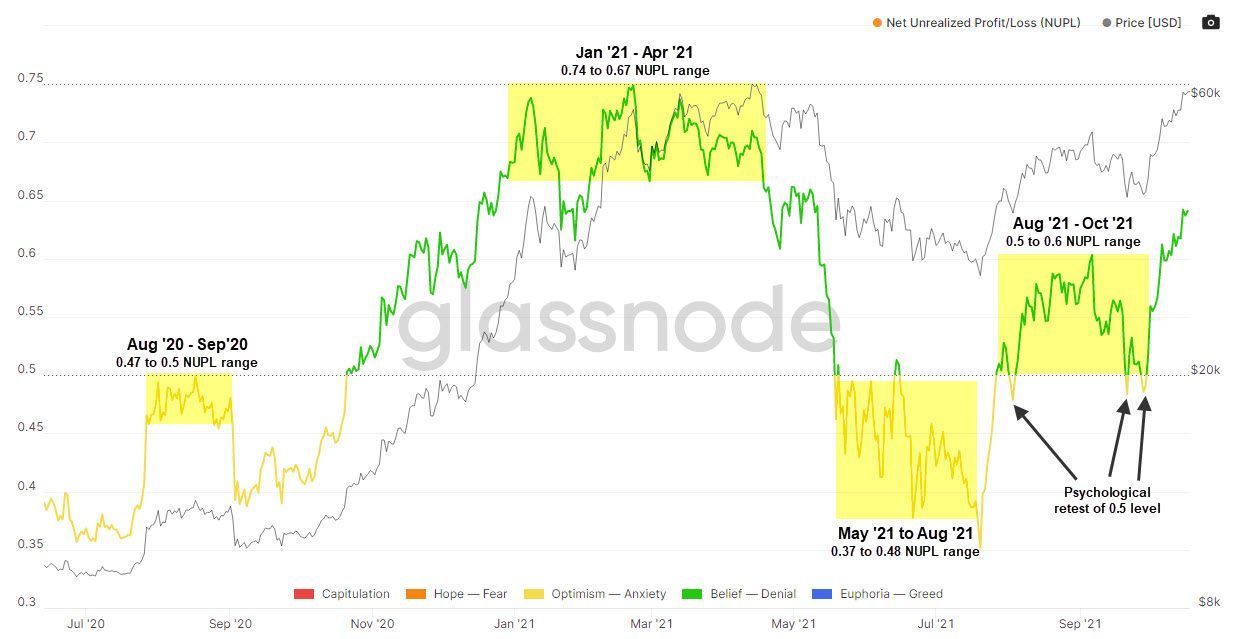
August 2020 - September 2020
The NUPL found a ceiling at 0.5 level, indicating that 50% of the market cap was made up of unrealized profit. This range is neutral in terms of market sentiment as it is characterized by sideaway price action.
January 2021 - April 2021
Following a large bull run, this period was marked with very postive investor sentiment as the NUPL ranged between 0.67 and 0.74. Approximately 70% of the market cap was made up of unrealized profit, which therefore created a strong incentive to sell.
May 2021 to Aug 2021
Sentiment really worsened following the price capitulation of May 2021. Price fell as 'coin holders' realized their profits which brought the NUPL down to a 0.37 to 0.48 range. Sentiment was negative during this range as all those investors that didn't sell at the top, were now seeing their unrealized gains fall. This can be psychologically painful for investors who have seen their portfolios reduced in value. This range was therefore characterized with fear, panic and overall poor sentiment in the market.
August 2021 - October 2021
The NUPL ranged between 0.5 and 0.6 and tested the support level of 0.5 on three occasions as indicated by the arrows, before bouncing back up. This support level can be considered as a psychological test of investor conviction, as they saw the value of their portfolios decline, which caused fear and bad sentiment. The investors that held on however started to see the value of holding, as markets recovered. This renewed positive sentiment is a good sign for prices.
October 2021 - Present
The NUPL has broken out of the range established in between August '21 and October'21 and is trending higher. Sentiment is becoming very positive as unrealized gains are increasing. This sentiment can drive prices higher and potentially lead bitcoin to a new all-time high.
What is happening in the Derivatives Market ?
The derivatives space is another layer of the market that is important to overview. Investors can use leverage and hedge risks with options, futures or perpetual swaps on the bitcoin market.
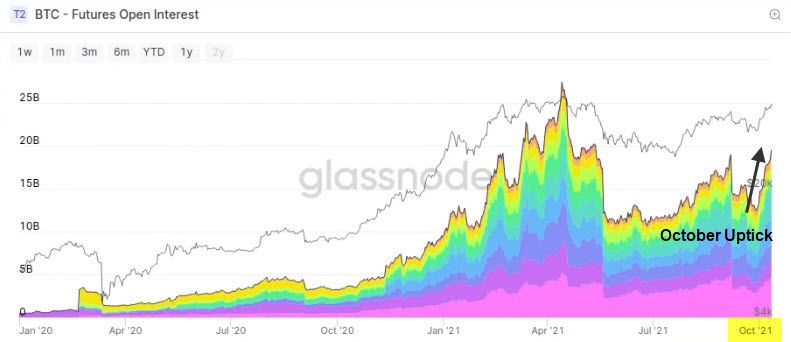
Futures Open-Interest
This metric illustrates the amount of open derivatives contracts in the market. If the metric trends highly, there is an increased risk of excessive leverage in the market, which could lead to a short-term fall in price, as investors can be long or short squeezed, like during the 'September Flash Crash'.
Below, we can observe a fairly strong climb up in October. With regards to excessive leverage and a potential market flush, there isn't neccesarily a risk. The likelihood of excessive leverage however has increased with the metric trending higher.
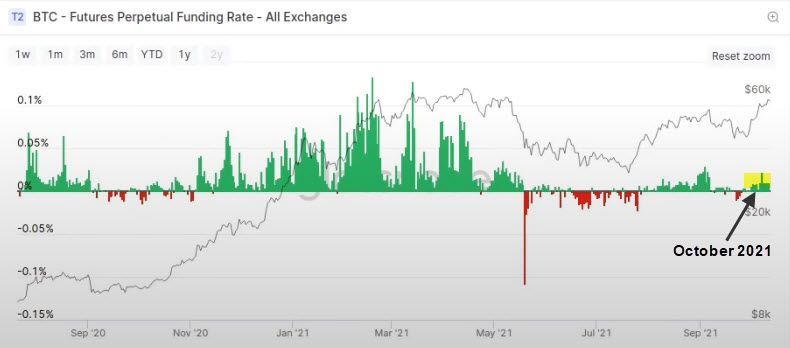
Futures Perpetual Funding rate
This metric desrcibes the interest rate paid by perpetual swap owners. Positive funding rates mean that investors are net long relatively to being short. This metric therefore determines the directionality of of 'Open Interest', or in other words, whether investors have opened more 'Long' or 'Short' positions.
The metric currently shows that there has been a gradual increase in positive funding rates (green) since the start of the month of October, and the directionality of the of Open Interest is that investors are net long.
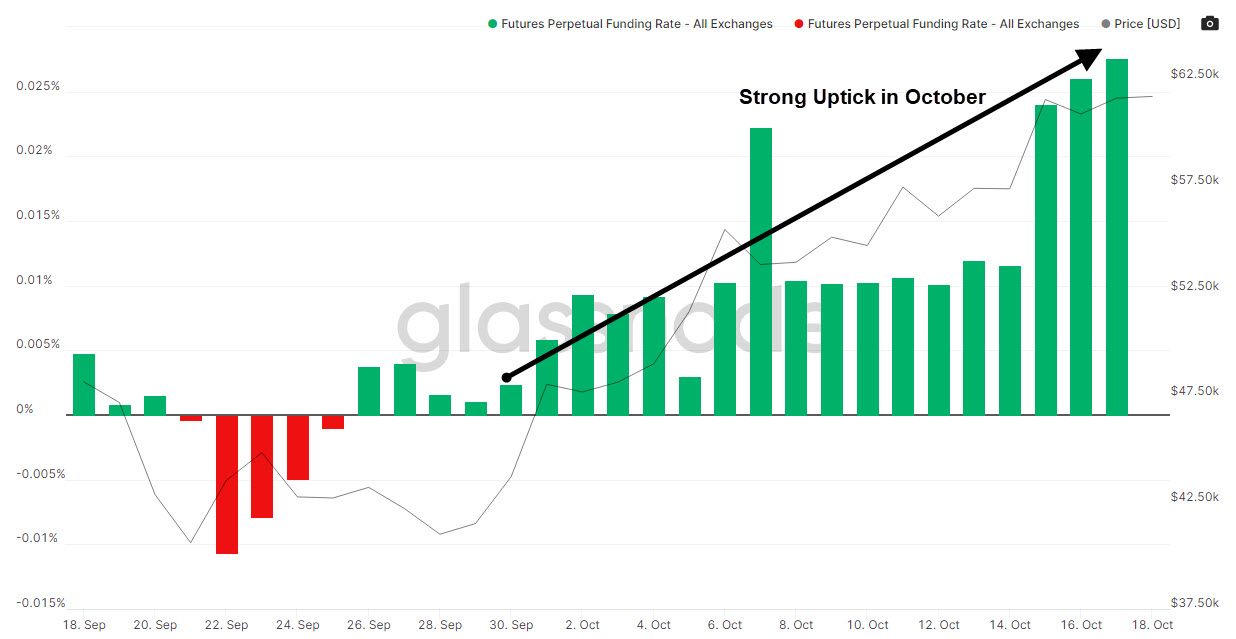
There is a potential risk of excessive leverage however it is not significant when we compare current funding rates to historic ones. Although there has been increases in long contracts, the derivatives market is still signficantly less active than it was in May 2021.
Concluding thoughts
The overall sentiment in the market is positive. The recent price rally has returned much of the supply of bitcoin to profit, and has increased investors' unrealized gains. All of these conditions are similar to the ones observed at the end of 2020, prior to the 2021 Bull run. If these dynamics continue to be observed, we could expect a spike in price that could lead Bitcoin to its new all-time high. Furthermore, despite the recent pick-up in open interest, the risk of a derivative-driven flush out is currently low, as futures activity is historically low at current price levels.
Intriguing times ahead for digital gold !
