What Happened
The Bitcoin market experienced a high volaitility sell-off on the 7th of September, which caused 330'243 traders to be liquidated in 24 hours for a total $3.54 billion. The main driver of the sell-off was the flushing out of excessive leverage in futures markets.
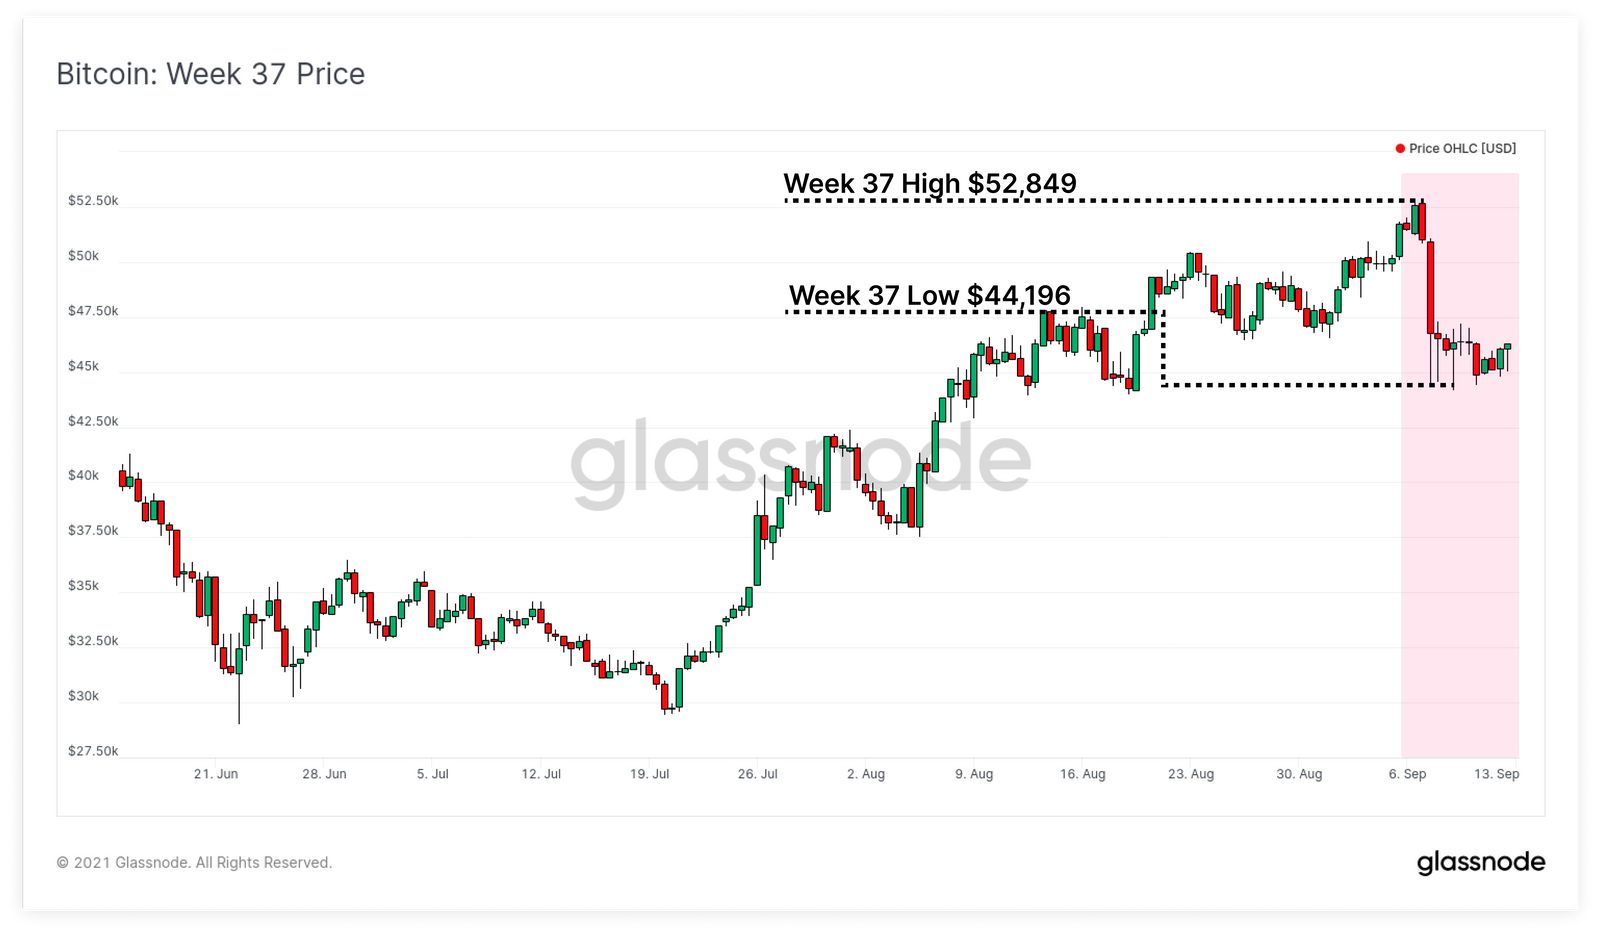
After Bitcoin experienced steady growth since mid-July, reaching monthly highs of $52’633, the price suddenly dipped by 15% to less than $43’000 on the 7th of September. The digital currency eventually recovered to $46’810 and is now trading at $47’180 at the time of writing. Other major 'Altcoins' also plunged in value on a day where most major crypto exchanges experienced technical issues and El-Salvador’s government officially started to use Bitcoin as legal tender.
Derivatives driven sell-off
To gain a better perspective on investor behaviour during the flash crash, it is useful to take a look at the data extracted from Bitcoin’s public ledger, and conduct ‘On-Chain Analysis’.
A downside price squeeze occurred during the flash crash as excessive leveraged positions were flushed from the market. The market correction was followed by a period of consolidation for the remainder of the week.
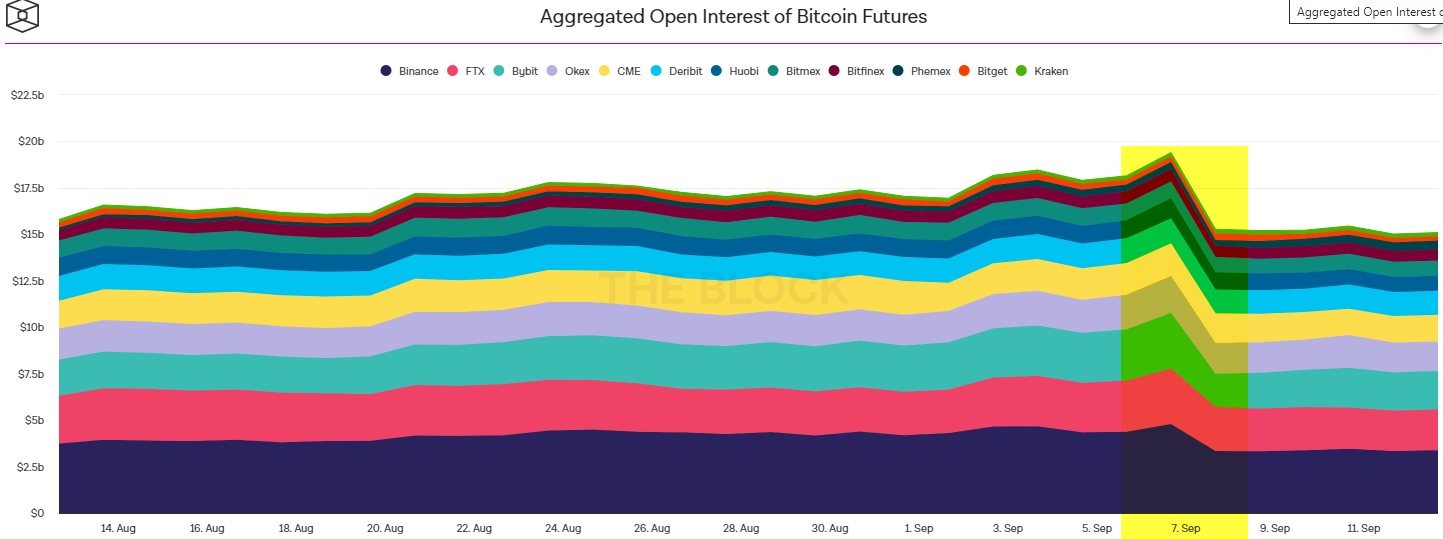
The 'Aggregated Open Interest of Bitcoin Futures' graph illustrates the total amount of outstanding BTC futures contracts that have not been settled yet. We observe a sharp decline in BTC Futures on the 7th of September from $19.41 bn to $15.27 bn, meaning that a significant amount ($4 bn or 30%) of contracts were settled.

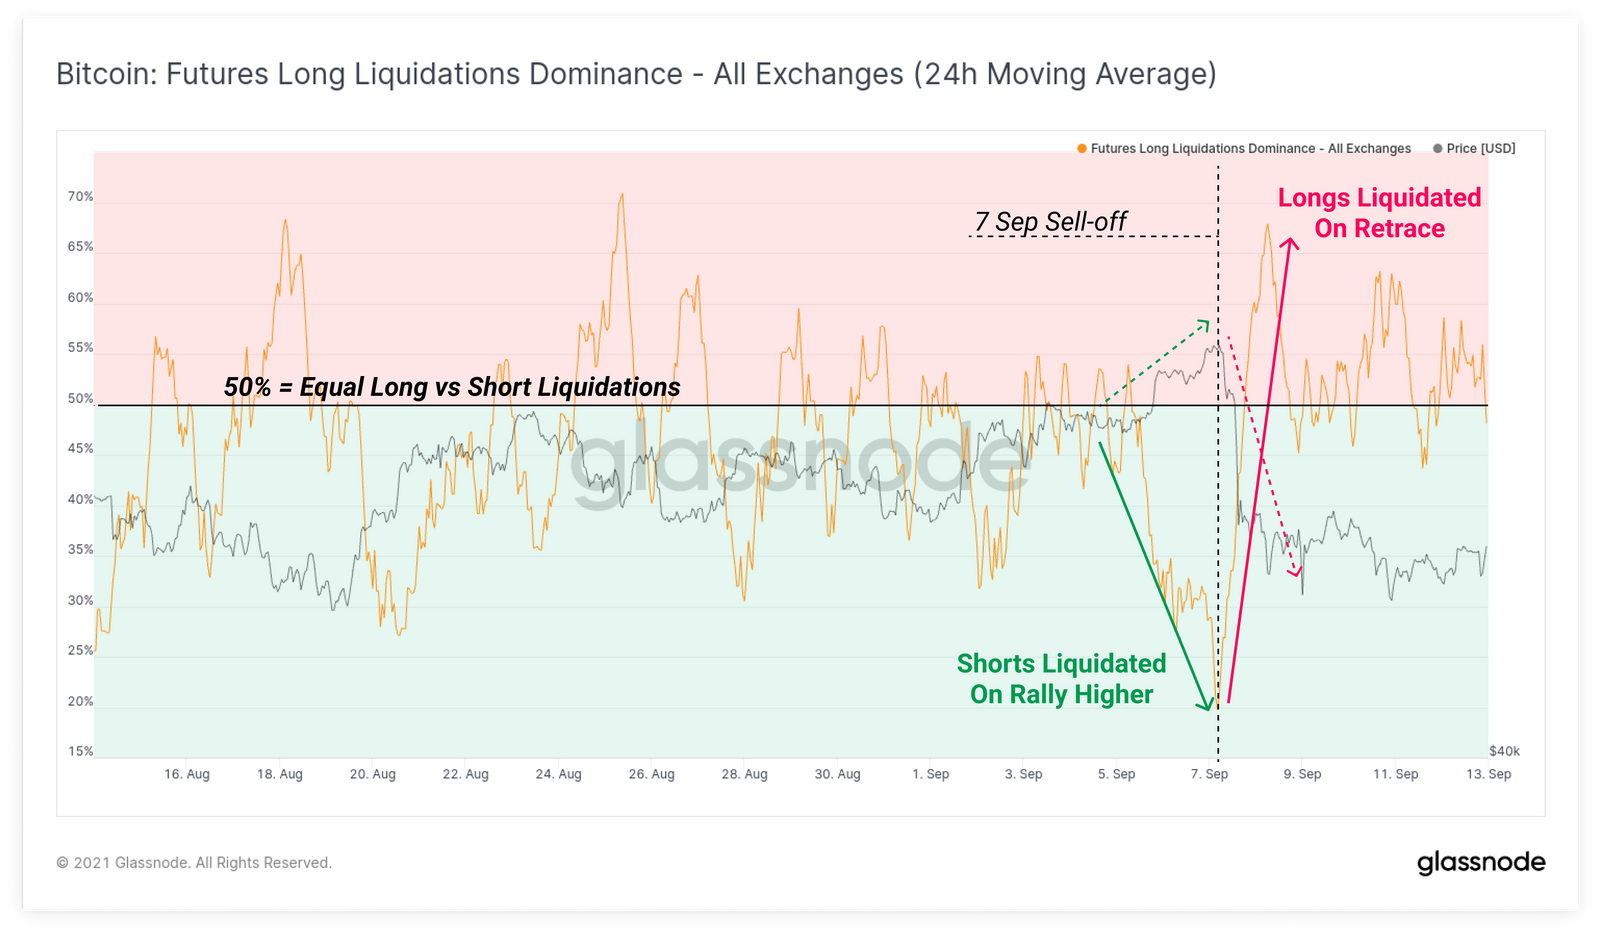
We can then see that most of the contracts settled during the hour of the crash were Long BTC contracts, as seen on the graph below. Prior to the crash, short liquidations represented 80% of all liquidations, leading the price of BTC to a new local high of $52'800. The graph then clearly shows the reversal of this price action, at the dotted vertical line, as the proportion of long contract liquidations jumped to 68%, causing BTC's price to decline by more than $10'000 from the new highs.
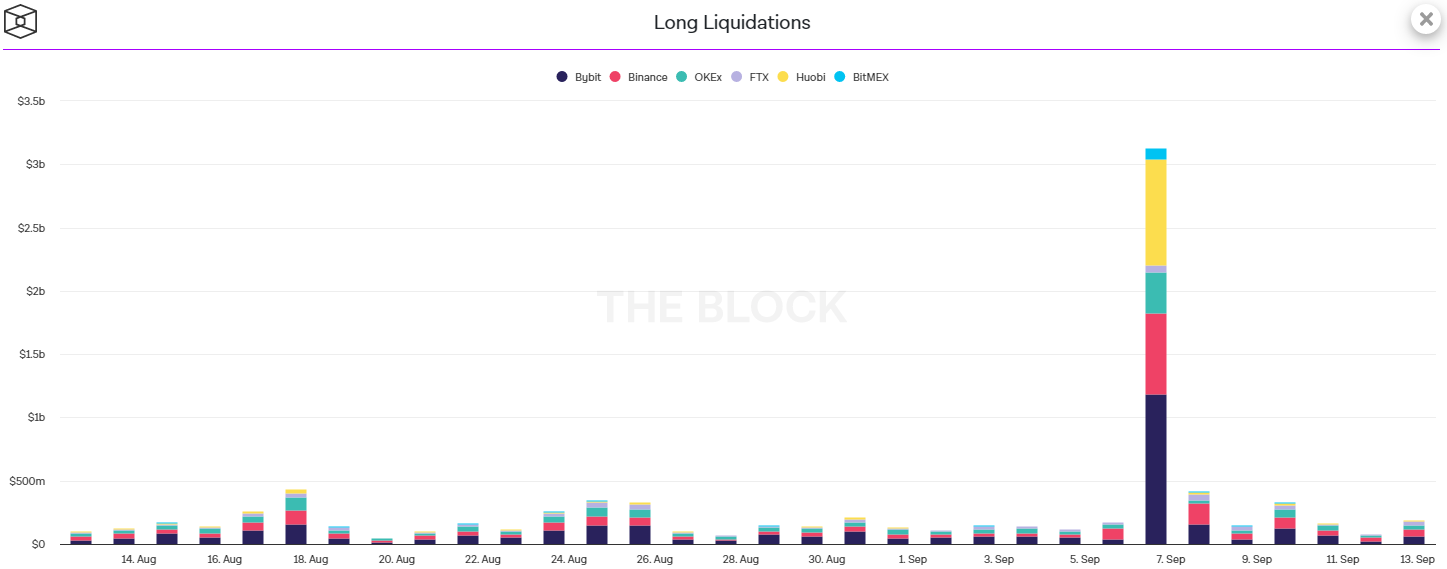
The decline of the price was swift and significant, relatively to monthly averages. This therefore can only be explained by the fact that most of the long contracts that were liquidated were using highly leveraged margin accounts. This can be proven by overviewing the platforms used during the spike in long liquidations. Huobi and Bybit are the two platforms that offer the highest margin rates in cryptocurrency trading, and processed the most long liquidations out of all the major exchanges during the crash as can be seen on the graph below.
The heightened downward price pressure was made worse by the temporary shutdown of several of the major cryptocurrency exchanges such as Coinbase, Gemini, Kraken, Binance, Bitfinex, CME and FTX US. The price decline prompted traders to get out of their positions or purchase the dip in price. This then caused a surge in exchange traffic and a clog in the Bitcoin blockchain. These interruptions worsened the downside price pressure and contributed to the drop in price to its daily low.
El Salvador makes Bitcoin Legal Tender

El Salvador officially made Bitcoin Legal Tender on the 7th of September and proceeded to purchase $21 million worth of the cryptocurrency. This news helps shed light on how the September Bitcoin crash was ultimately triggered.
Traders were prompted to buy and go long BTC after the law was passed. The price of Bitcoin enjoyed a steady recovery since the May crash. It reached a new local high of $52'800 in September on the day El Salvador officially adopted Bitcoin as legal tender. Consequently, investors that had gone long when the news was released, proceeded to take their unrealized gains, and cause the start of the decline in price. The case of 'buying the rumor, selling the news' perfectly summarizes the circumstances surrounding this crash.
The decline in price was exacerbated by the liquidation of highly leveraged long positions as discussed above, which caused a cascading sell off effect, further perpetuating the price decline to over $10'000 BTC.
Bitcoin Exchange Reserves continues to decline
The 'All Exchanges Reserve' is an indicator that shows the amount of BTC held in all wallets of centralized spot exchanges. Historically, there has been a negative correlation between the price of BTC and the amount of BTC stored on exchange wallets. This is because investors send their BTC to exchanges to either convert them to fiat or to purchase alt-coins, which decreases the price of Bitcoin.
An example of this correlation can be seen in the lead-up to the 2021 bull run. The gradual increase in price since October 2020 was accompanied by a steady decline in BTC stored on exchanges. Investors were accumulating more coins, which drove BTC prices higher, as the supply of the coin was constrained.
Subsequently, when the price of BTC reached its all-time-high (ATH), the BTC exchanges reserve metric had gradually climbed back, suggesting a sell-off which ultimately lead to the May Crash in 2021.
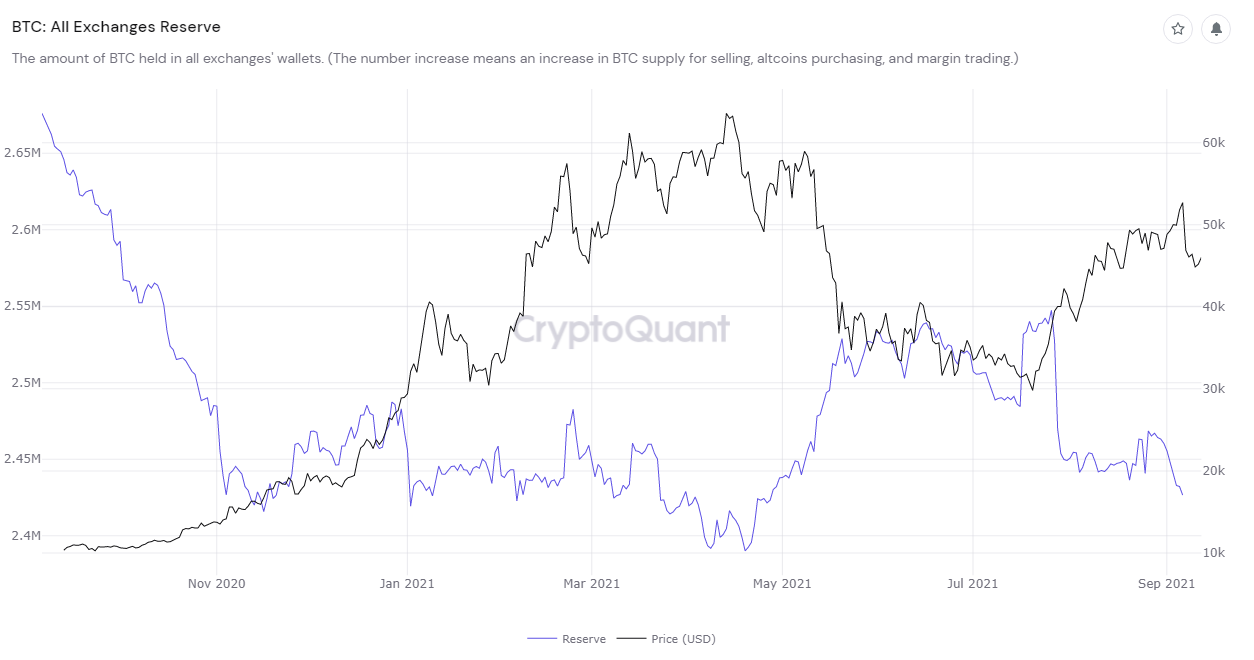
When analyzing the September crash, historical patterns would've predicted BTC exchange reserves to have increased. Interestingly however, this was not the case as the BTC exchange reserves continued to decline, despite the sharp sell-off. This is due to the fact that the September crash was largely driven by derivatives, and not spot exchanges like in May 2021. This therefore implies that investors haven't been quick to selloff on spot exchanges and instead are holding their BTC, off-exchange or on derivative exchanges (to open new long positions) instead of speculating, in anticipation of higher highs.
After overviewing the various on-chain metrics and their relation with the development of Bitcoin's price, we conlcude that we hold a bullish outlook for Bitcoin's price.
