
Will history repeat itself ?
Bitcoin is set to reach an all-time high during Q4 of 2021, as it did in Q4 of 2013 and Q4 of 2017. Its price has so far moved in predictable four-year price cycles, marked by four phases; Exponential Growth, Correction, Consolidation, Continuation. It is therefore worth looking at what past price cycles are telling us about Bitcoin's future.
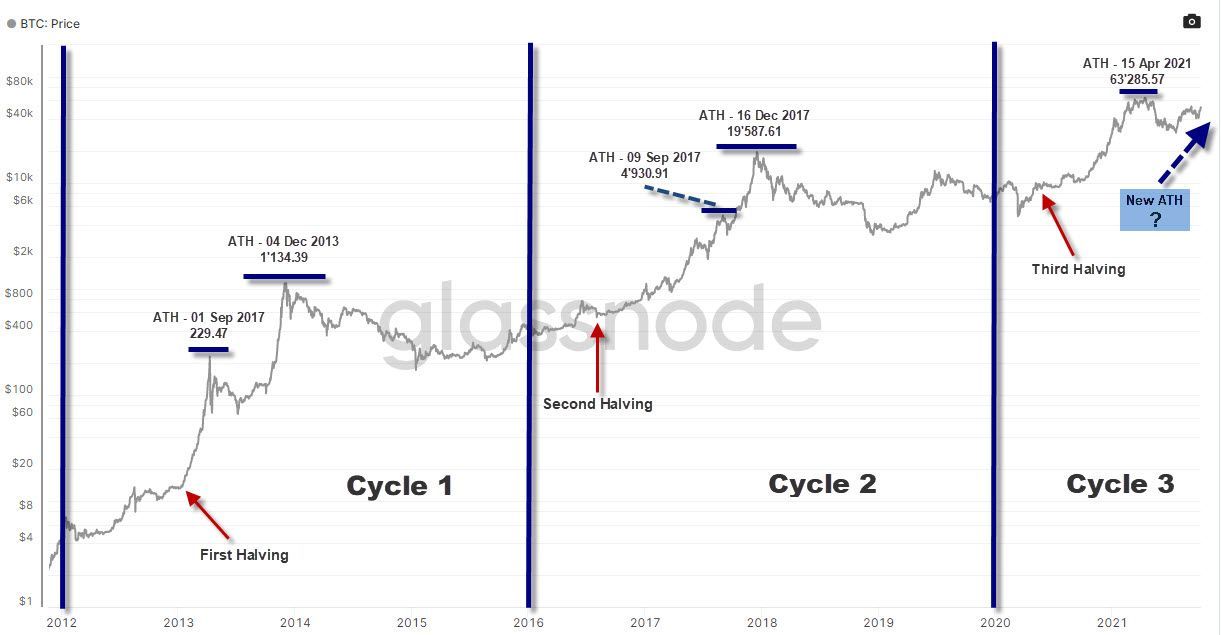
The halving events of Bitcoin's supply is important to keep note of. The reward for mining bitcoin transactions or the rate at which new bitcoins enter into circulation is halved every four years. The halving events of 2012 and 2016 have correlated with intense boom and bust cycles, sending Bitcoin's price higher than what it was prior to the event.
Each halving event since Bitcoin's inception is indicated on the graph below, with the latest halving occuring in March 2020. Each cycle is marked by two discernable spikes in price as indicated below, leading to new all-time high prices each time. We are currently in Cycle 3, and have already observed the first price spike when Bitcoin reached a new all-time high in April this year. The cyclical pattern therefore suggests that we are due for a second price hike, and again lead Bitcoin to a new all-time high.
Below is another comparative chart, highlighting the strucutral similarities between bitcoin's price developments in 2013, 2017 and now 2021. This comparaison suggest that bitcoin is due to for a large uptrend this year.
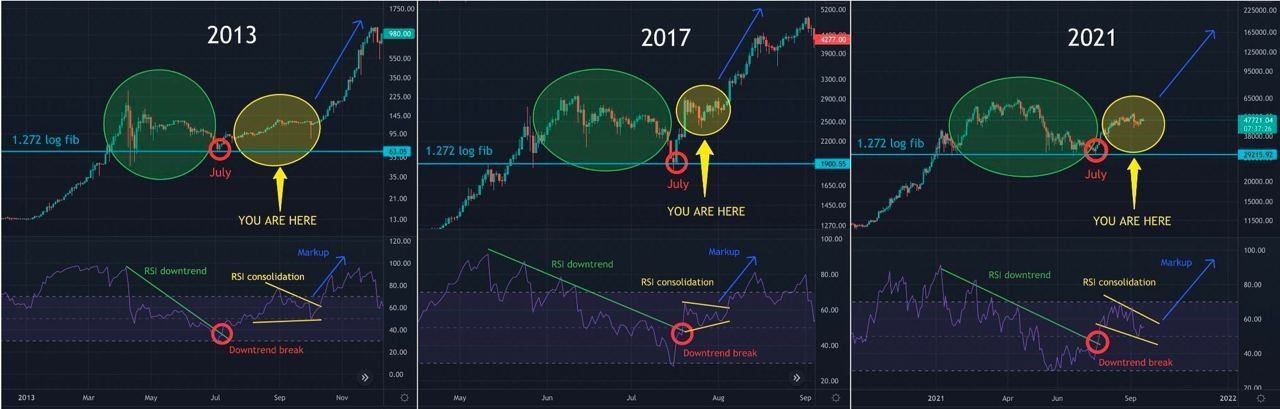
We expect Bitcoin to reach a new all-time high in Q4 of this year, as it did in 2013 and 2017.
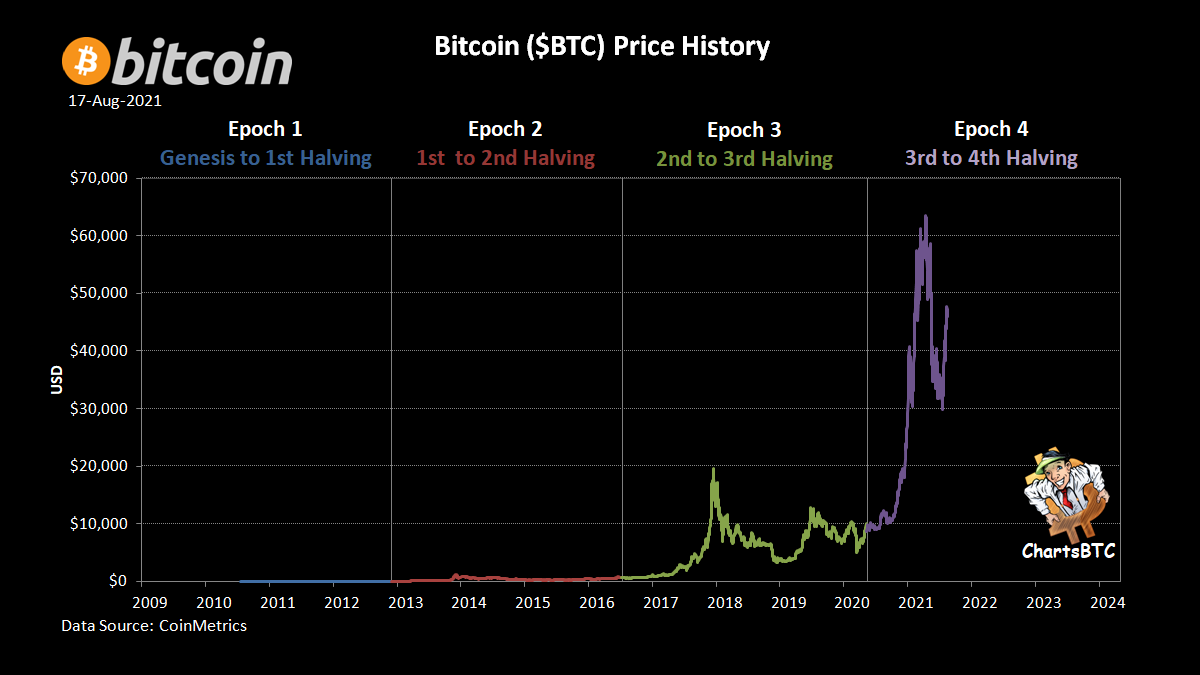
The chart below is a slightly different representation of the different cycles or 'epochs' Bitcoin has experienced since its creation.
What can be observed 'On-Chain'
We can extract insightful investment signals for Bitcoin by analyzing its blockchain. By viewing this data, we can conduct 'on-chain' analysis by viewing many metrics that provide a fundamental framework for measuring Bitcoin's intrisic value.
Investors are buying and looking to hold
The 'number of transactions chart' is an important metric to monitor as it provides a useful proxy for the demand and usage of the bitcoin blockchain network. It illustrates the total amount of transactions per day. The higher the metric, the more bullish it is for Bitcoin as it signals more market participants and increased relative interest in Bitcoin.
Since the lows reached in July'21, the metric has steadily increased and stabilized during the month of September '21. The zone formed in September '21 can be considered as a new baseline of holding investors that provided the September 41k-49k range stability. Holding investors are those with high conviction for Bitcoin, and therefore look to accumulate and hold Bitcoin.
Given the newly established baseline of holding investors, it is important to examine whether it is likely for this base to hold the current price range and put enough bid support under the market to push the price higher (Bitcoin has pushed to 51k at time of writing).
Will new baseline of long-term investors push prices higher ?
We can look at the 'Coin Days Destroyed' metric to gain a better understanding of whether bitcoin holders are more likely to hold or sell. This metric assigns an 'age' for every single coin 'on-chain', by generating one-unit of 'coinday', per day. The chart below describes how many 'coin-days' have been destroyed over the past 90 days through transactions.
The higher the metric, the 'older' the bitcoins being spent in a transaction, suggesting long-term holder (bitcoins held for more than 155 days) activtiy.
A sharp increase in the metric coincided with the July '20 to Jan '21 bull-run, meaning that long-term holders sold into market strength to realize profits, which ultimately lead to a market top. Conversely, the lower the metric, the younger the bitcoins being spent, suggesting accumulating behaviour by investors.
Coin Days Destroyed
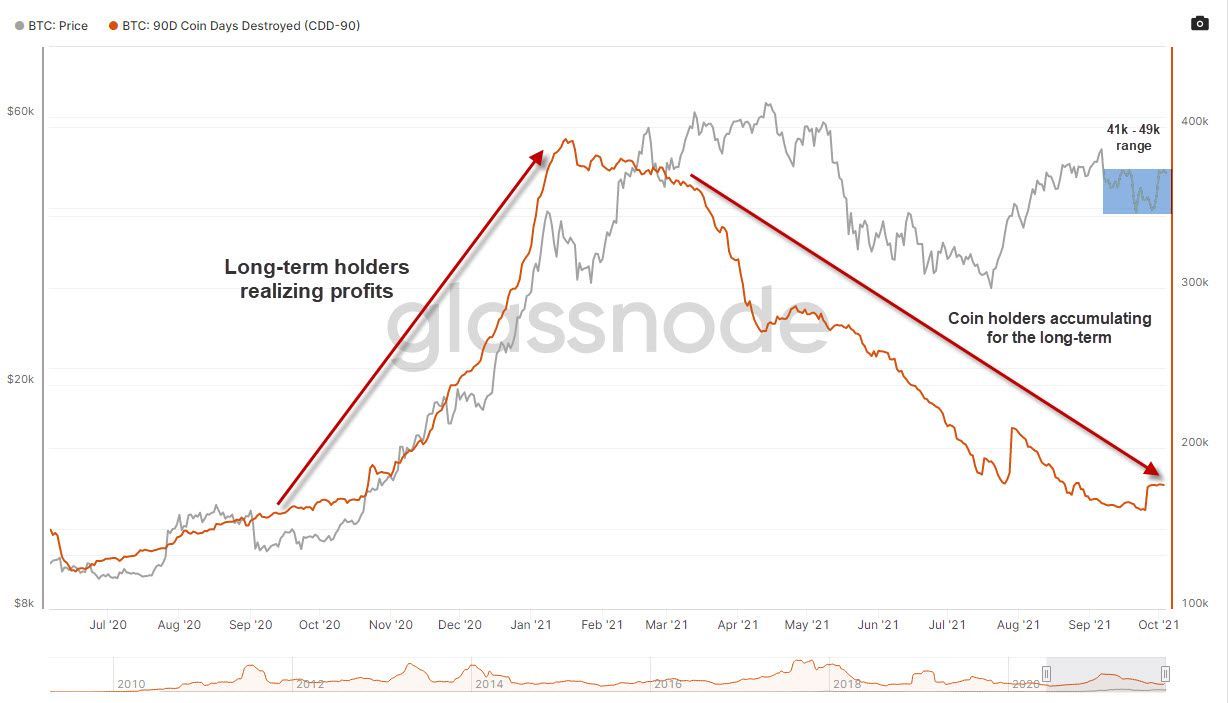
The metric has experienced a gradual decline since March '21, meaning that fewer coin-days are being destroyed, which suggests that coin holders are accumulating bitcoins and are preferring to hold onto them for the long-term.
Based on this metric therefore, it is likely that this base of long-term holders will hold price levels which is an encouraging sign for Bitcoin, as it provides the foundation for the coin to push to a new all-time high.
Long and Short Term Holder Supply in Profit / Loss
We can confirm that prices will at least hold if we refer to the 'Long and Short-Term Holder Supply in Profit / Loss' chart below. The metric describes the relative amount of circulating supply held by long-term holders (LTH) and short-term holders (STH), along with whether they are in profit or loss.
LTHs are investors that are looking to accumulate and hold their bitcoins whereas STHs are looking to day-trade and make quick gains.
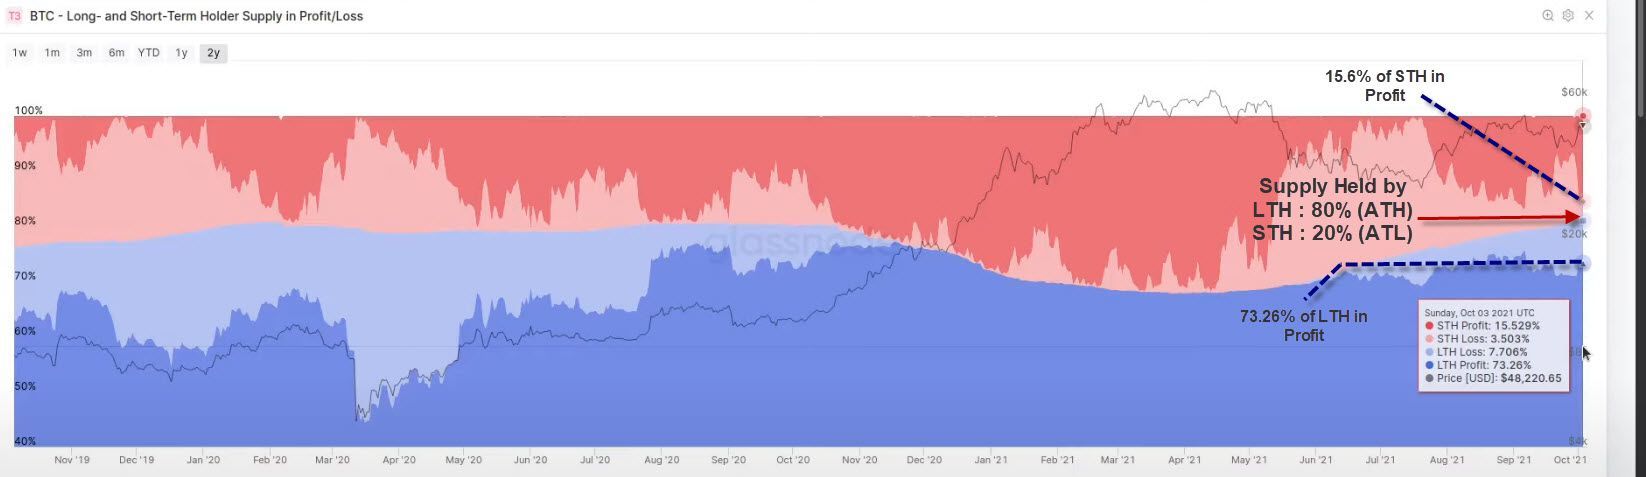
Currently, the supply owned by LTHs is at an all-time high of 80%, with STHs at an all-time low of 20% of supply.
LTHs have been capturing and storing much of the supply of Bitcoin, which is why the allocation of supply to LTHs today is at an all-time high. The bitcoins that day-traders (STHs) were buying and selling have gradually been absorbed by accumulators (LTHs) and stored off-exchanges. This decreases the supply of bitcoins available for sale as a result, which is a positive sign for bitcoin price, however more on Bitcoin Supply dynamics below.
Furthermore, the breakdown of profitability can also be observed between LTHs and STHs. LTHs and STHs own 73.26% and 15.6% of the Bitcoin supply that is in profit respectively. 89% of the total supply of Bitcoin is therefore in profit, a new multi-week high. New bitcoin holders have been quick to make unrealized gains as the supply of bitcoins held by STHs in profit (dark red) spiked to 15.6% in the last week.
Prices have therefore stabilized during September '21 within the 41k-49k range, as long-term investors accumulated bitcoins from day-traders. This price stability and the decreased supply of bitcoins available for sale are bullish conditions for Bitcoin, and could push prices higher. Prices interestingly enough have already started to push out of the 41k-49k range as Bitcoin is currently trading at 51k.
Will decreasing liquidity cause a supply squeeze ?
Net Transfer Volume from / to Exchanges
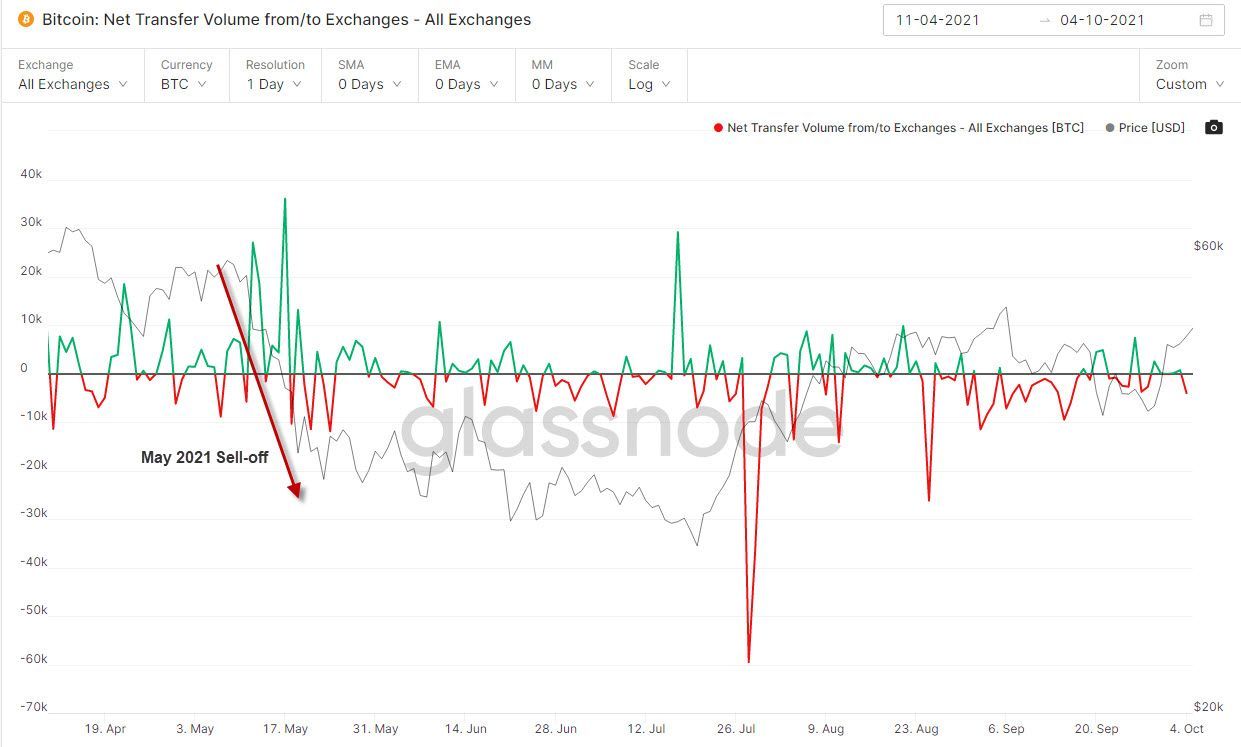
The increased accumulation of bitcoins by investors can be observed through the 'Exchange Net Flow Volume' below. This metric aggregates all bitcoins that flow into and out of exchanges and is a fair indicator of investor behavior. If inflows (green) are significant, an increasing amount of investors are moving their bitcoins to exchanges to sell their Bitcoins. Conversely, if more investors are moving their bitcoins off exchange (red), it is likely to store them in their wallets.
We can observe signficant outflows of bitcoins from exchanges since the May 2021 sell-off, because investors are accumulating bitcoins by storing them off exchanges.
Highly Liquid & Illiquid Supply
The metrics below paint a more macro picture of the accumulating behavior observed by bitcoin investors recently.
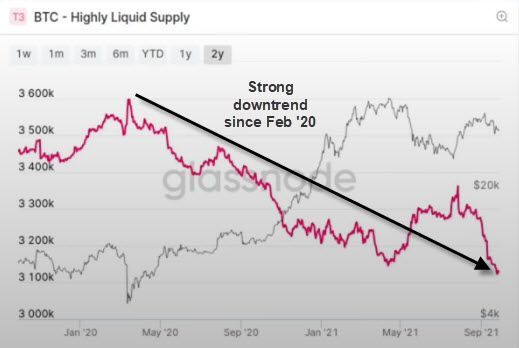
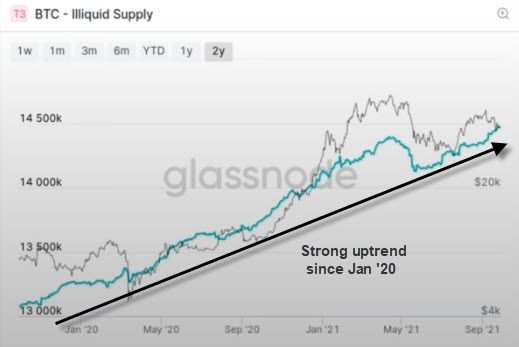
The 'Highly Liquid Supply' metric shows the total supply of bitcoins that can be exchanged directly on exchange platforms. Conversely, the 'Illiquid Supply Metric' shows the total supply of bitcoins that have been held off-exchange and in investors' wallets for an extended period of time. We can observe a strong downtrend in highly liquid supply since March 2020. This is because an increasing amount of investors have accumulated and stored their bitcoins, confirming what we observed above with the signficant outflow of bitcoins from exchanges.
Conversely, we can see a strong uptrend in illiquid supply since January 2020, with the metric now reaching an all-time high of bitcoins held off-exchange and in investors' wallets.
These supply dynamics confirm the accumulation of bitcoins that we have uncovered in this report thus far. If we continue to observe this accumulating behaviour, the supply of Bitcoins available for sale will continue to decrease, and could potentially culminate in a supply-squeeze, which would send Bitcoin's prices much higher.
It is therefore important to keep these metrics in mind, as they could indicate a potential trigger for Bitcoin's price to reach a new all-time high.
Opportune time to buy Bitcoin
NVT Ratio
The Network Value to Transaction Ratio or NVT ratio is an important metric to monitor as it indicates whether Bitcoin is under or overvalued. It is comparable to the Price-Earnings ratio used in equity markets, as the metric is calculated by dividing the Network Value (market value of shares) by the daily USD volume transmitted on the bitcoin blockchain (total earnings).
When the NVT ratio is high, it indicates that Bitcoin's network value is outstripping the value transferred by its network.
More simply, the higher the NVT ratio, the more overvalued Bitcoin is.
The graph below illustrates the average daily NVT ratio relatively to Bitcoin's price, plotted over the last two years. Interestingly, whenever the ratio has bottomed to a multi-month low, it has coincided with a sharp increase in price. This pattern can be observed on three seperate occasions in the last two years, as low NVT ratios led to a 50% price hike in April 2020, the 2021 Bull run which led to Bitcoin reaching its all-time high price, and the more recent August rally which saw bitcoin's price recover by 45%. This is because a low NVT ratio presents a great buying opportunity for investors, as the price of bitcoin is undervalued relatively to the market price.
Currently, we can observe an extremely low NVT ratio again (a multi-week low), which presents a great opportunity to buy bitcoin as it is extremely undervalued.
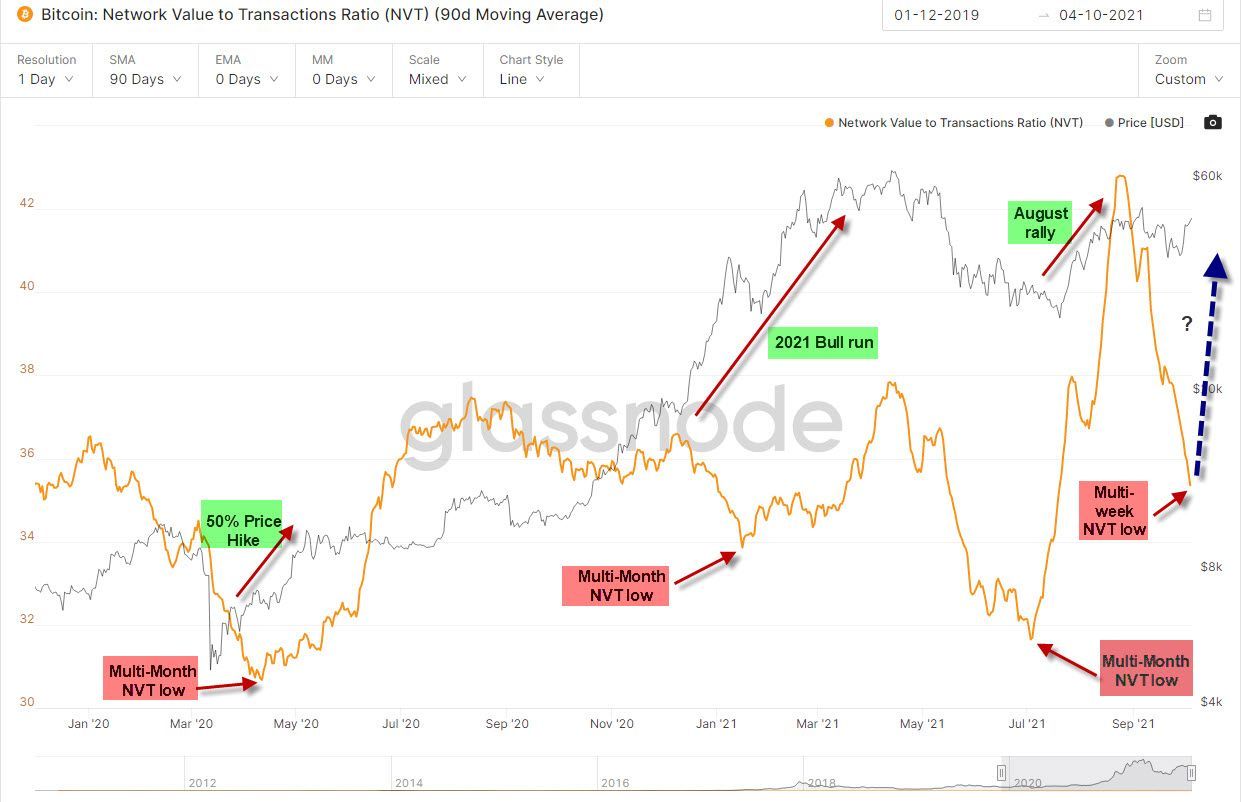
If the pattern we observed in the last two years holds true, we should expect another significant price hike.
For more information on NVT ratios visit: [https://charts.woobull.com/bitcoin-nvt-ratio/]
Digital Gold
Bitcoin is often compared to Gold due to the similarities both assets have. Although one is physical and the other digital, they share several properties that make them extremely comparable, relatively to fiat currencies.
They both have a limited supply of units, as the supply of Bitcoin is limited to 21 million (limit expected to be reached in 2140), whereas the supply of gold on earth is finite. Furthermore, both assets are independent of the government or any financial system, which makes them both a favored hedge asset, as they both have limited correlation with other asset classes.
The graphs below represent Gold's price over the last 100 years (left) and Bitcoin's price over the last 10 years (right). Interestingly, we can observe a very similar price development between both assets, notably the three distinct price spikes as indicated with the red arrows on each graph. Currently, we are midway through Bitcoin's third price hike. If Bitcoin follows gold's price development, we could expect Bitcoin's third price spike to take prices to a new all time high.
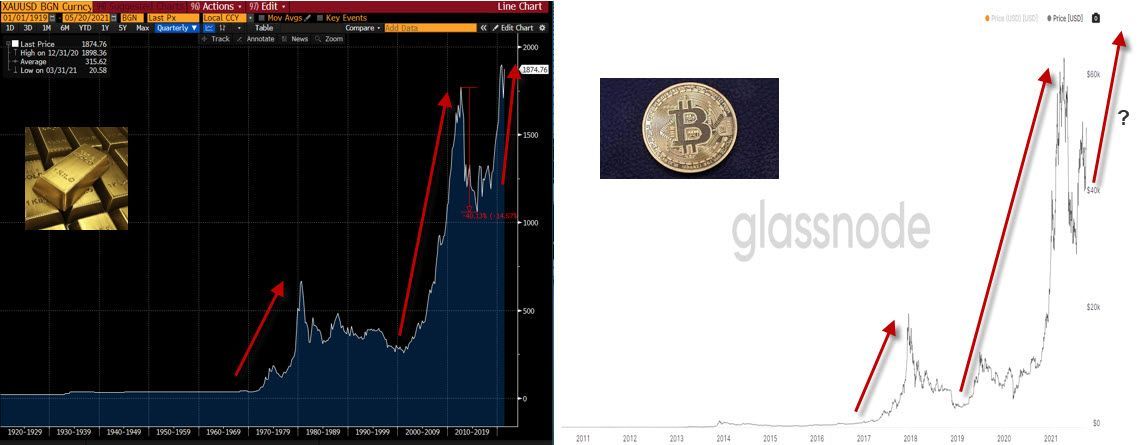
It is important to keep in mind that Bitcoin's price evolution is plotted on a 10 year time frame, compared to Gold's 100 years. Bitcoin's price therefore has and will continue to evolve in an accelerated manner compared to Gold.
Sky is the limit
Past price cycles suggest that Bitcoin is due for a second cyclical price hike that would push it to a new all-time high. This view is affirmed by on-chain metrics after review of the underlying investor activity and bitcoin fundamentals. The market is dominated by investors accumulating bitcoins and holding them for the long-term, dropping the supply of bitcoins available for sale. This coupled with the fact that Bitcoin is extremely undervalued provide ideal bull conditions for Bitcoin to sky high to a new all-time high.
