XRP Long Term Chart
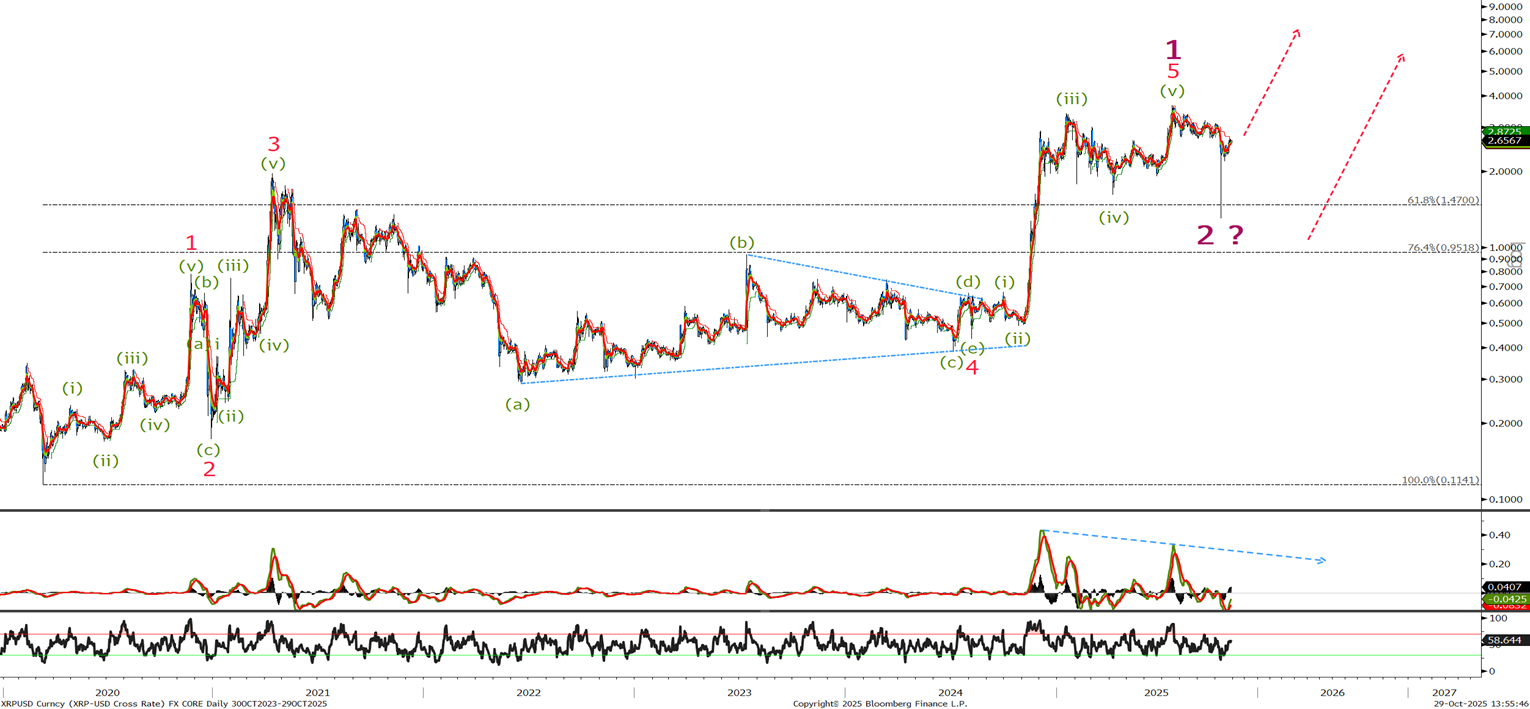
Following the 72% crash on the 11th of October with a range of lows recorded including 0.75 on Binance , technically a significant correction should be over. These moves require looking at the log chart due to their extreme price action for a clearer picture and given that we overshot the 61.8% level, the minimum targets have been met so we need to look to the short term chart for greater clarification. Long term even if the recent crash low is only wave (a) of a larger correction back to below 1.00 the long term outlook is a push to $9-12.
XRP Short Term Chart
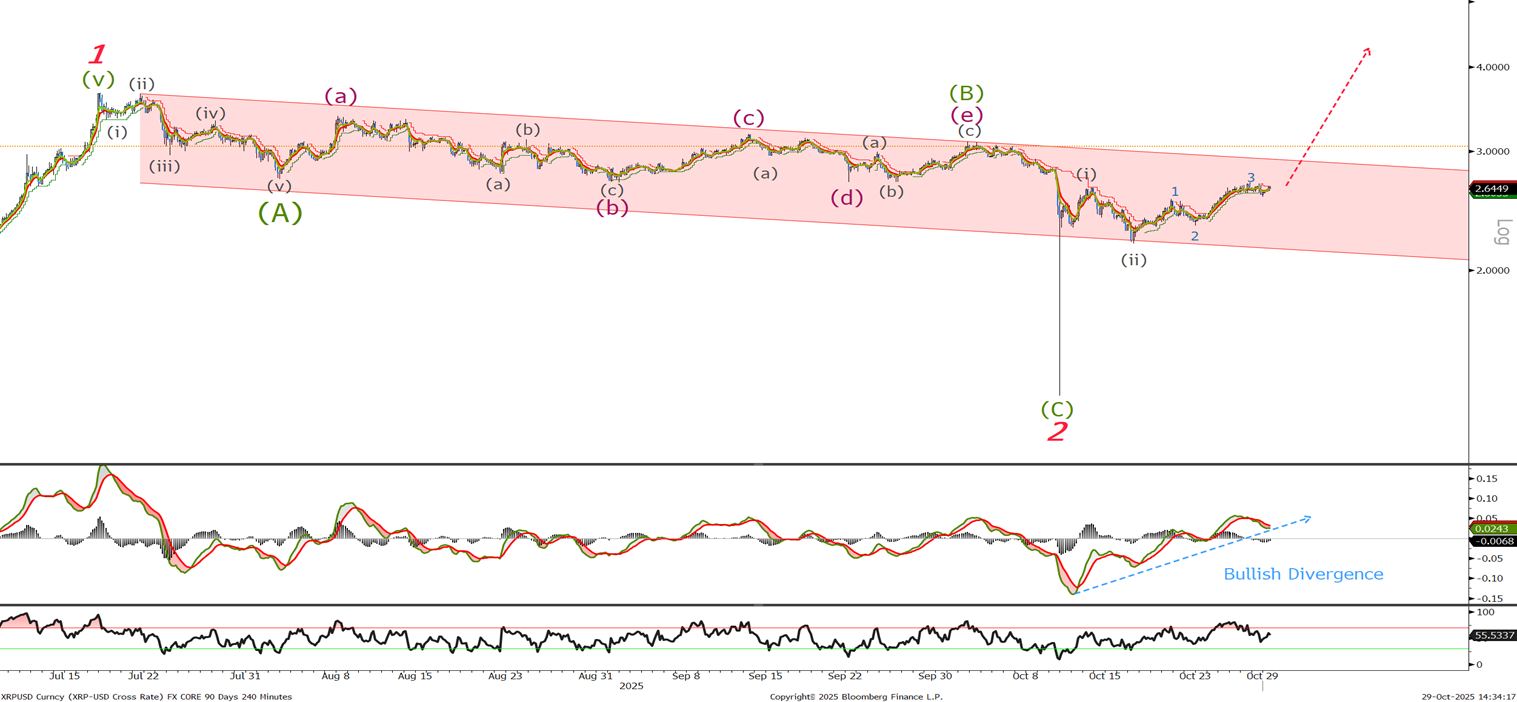
If we look to the short term chart we can see the upward blue arrow indicating that momentum has swung to the bullish side and I hope to see another push higher in the short term to complete 5 waves higher to confirm wave (iii) is complete, if we turn from current levels and break below 2.30 then look to buy around 2.10 and add 1.95 and 1.8. A break below 1.60 will push odd that a larger correction as shown on the previous page is underway. But happy to buy and hold.