
WEEKLY MARKET DIGEST • October 19 – October 26, 2026
TLDR
- From the Oct 16 close to Oct 23, gold fell 4.14% while Middle East headlines left WTI up 2.3%.
- US 10y -11bp from the Oct 16 close to Oct 23 as housing weakness reinforced slower-demand trades.
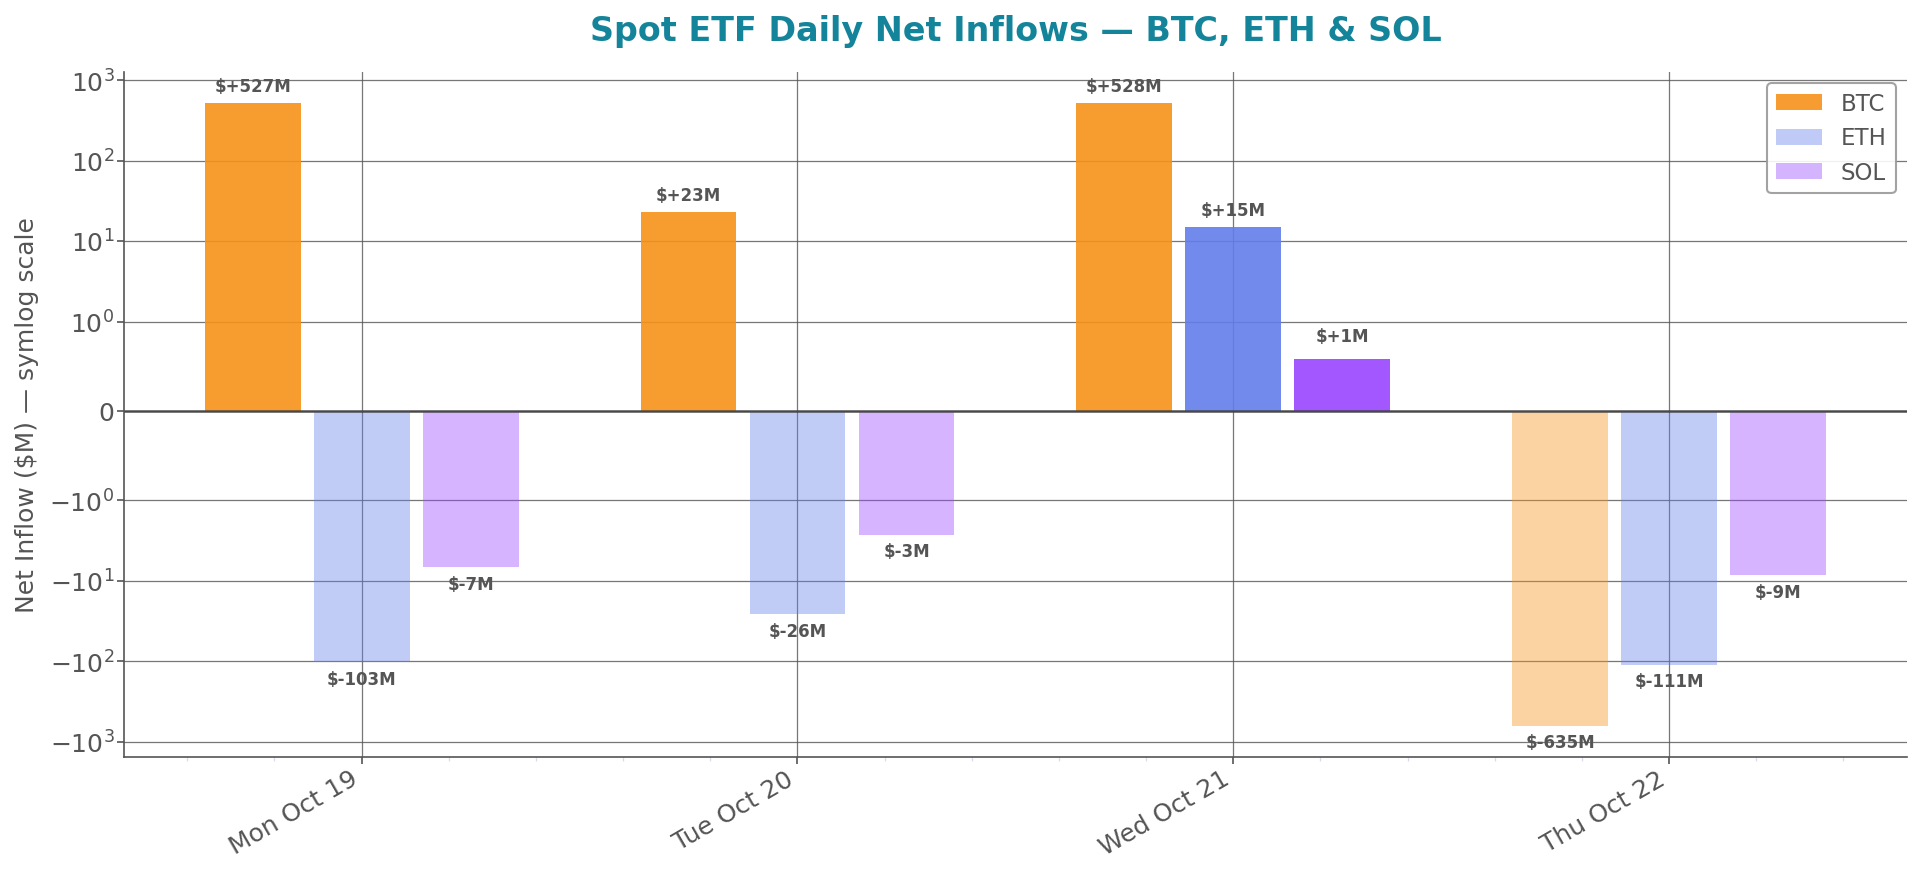
- BTC ETFs took in $443M from Mon Oct 19 to Thu Oct 22; ETH ETFs lost $225M.
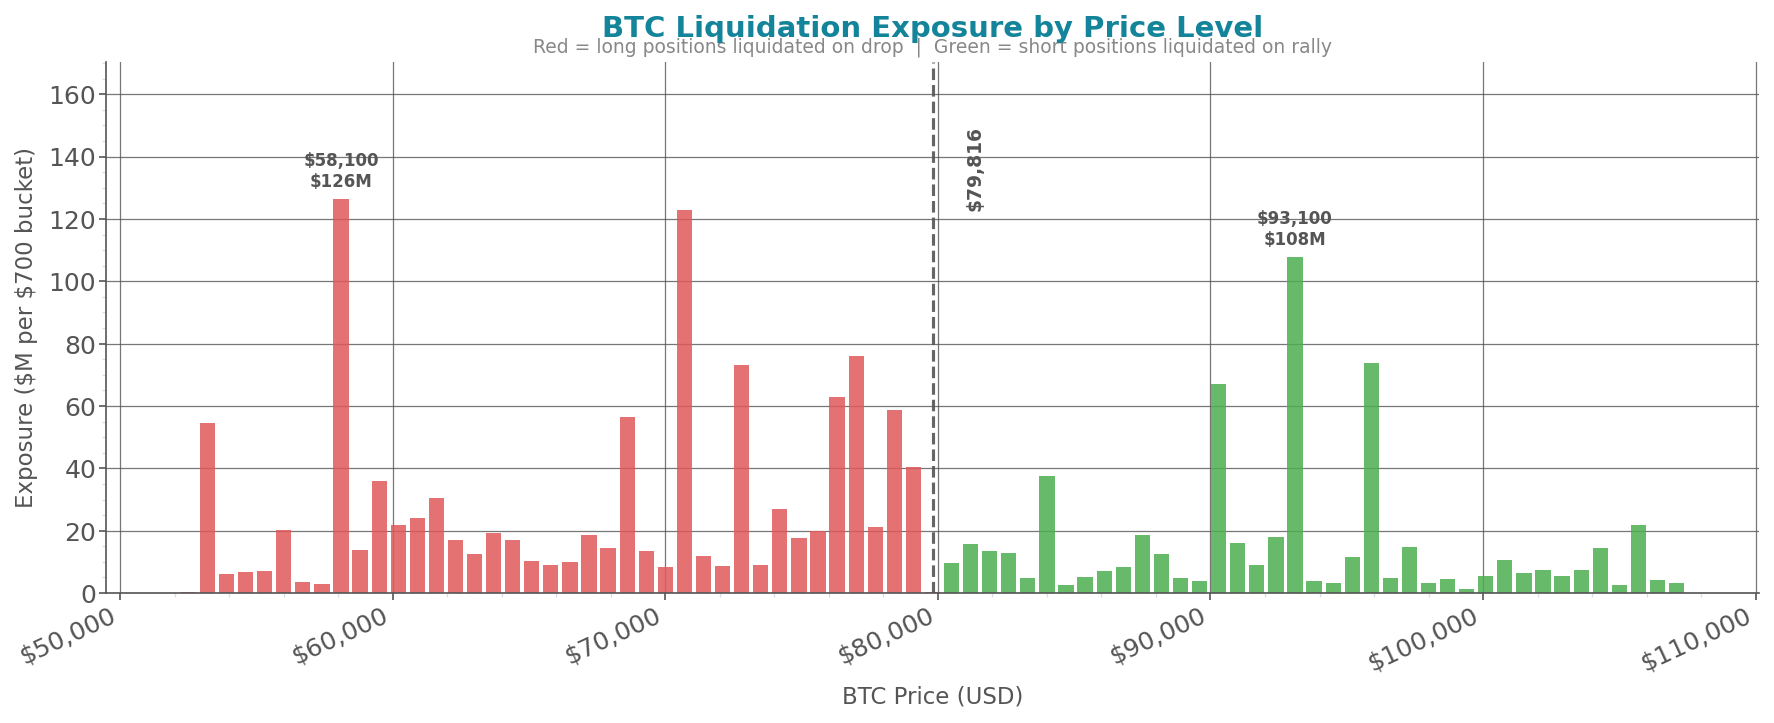
- BTC's $78,400 long-liquidation stack and ETH's $2,180-$2,160 bands are next week's key downside levels.
Weekly Market Performance
| Asset | Week Open | Week Close | Weekly Change | 1M Change |
|---|---|---|---|---|
| Global Crypto Market Cap | $2.76T | $2.67T | -3.12% | — |
| S&P 500 | 7,659.44 | 7,623.68 | -0.47% | -1.55% |
| Dow Jones | 52,002.41 | 52,215.16 | +0.41% | +0.75% |
| Nasdaq | 26,140.03 | 25,955.34 | -0.71% | -4.11% |
| VIX | 19.99 | 19.45 | -0.54pp | +4.58pp |
| Bitcoin (BTC) | $82,702 | $79,852 | -3.45% | -4.80% |
| Ethereum (ETH) | $2,429 | $2,310 | -4.90% | -13.91% |
Macro Highlights
Oil risk remains two-sided: Houthi attacks on Saudi energy infrastructure have increased concerns about supply disruption, while investors are also weighing the potential demand impact of elevated crude prices. On Thursday, October 22, President Donald Trump accused Iran of exaggerating or fabricating shipping incidents to drive oil prices higher. On Friday, October 23, WTI crude settled at $103.27 per barrel, finishing the week about 2.3% higher. Prices subsequently fell on Monday, October 26, as traders reassessed the balance between geopolitical supply risks and the economic impact of higher energy costs. The extent of any demand destruction remains uncertain.
(CNBC) (Bloomberg) (Reuters) (Nasdaq)
The AI trade remains sensitive to questions about capital expenditure, financing requirements and the returns on data-centre investment. On October 18, Anthropic announced plans to commit 5% of its shares to a new public-benefit fund, subject to shareholder approval. Meanwhile, the Nasdaq Composite fell from 26,140.03 on October 16 to 25,955.34 on October 23, a weekly decline of 0.71%. Investors continue to assess whether expected AI-related revenues will justify the industry's substantial investment requirements. Copper prices and AI-related equities have also attracted attention amid concerns about growth and risk appetite.
(CNBC) (Bloomberg)
Brazil's presidential runoff on October 25 resulted in Luiz Inácio Lula da Silva's reelection, with 51.79% of valid votes against Flávio Bolsonaro's 48.21%, according to the electoral authority's final published count. Bolsonaro refused to concede and called for the result to be annulled, creating uncertainty around the political transition. For investors, the implications for Brazilian equities and the real will depend on fiscal policy, the transition process and the new administration's economic agenda.
(Financial Times) (Bloomberg) (CNBC)
The Fed enters its October 28 policy meeting with September U.S. CPI inflation at 3.7% year over year, core CPI at 2.6%, and PPI final-demand inflation at 6.3%, and with markets pricing a meaningful probability of a rate hike by year-end. On October 23, gold futures settled at $4,007.90 per ounce, down from $4,181.10 on October 16, a weekly decline of 4.14%. Reuters attributed the pressure on gold partly to rising energy prices, renewed inflation concerns and expectations of tighter U.S. monetary policy, alongside selling associated with losses in technology stocks.
(BLS) (Reuters)
Geopolitical risk continues to affect diplomatic staffing, regional security and energy-market expectations. On October 23–24, U.S. officials and news reports highlighted concerns about Iranian plots against American personnel and changes to diplomatic staffing in the Middle East, following an earlier departure order for non-emergency personnel in Saudi Arabia. In Europe, Serbia's former President Aleksandar Vučić, who resigned in September to run for prime minister, conceded defeat after the October 25 parliamentary election, won by the student-led Student List movement. Separately, continued Russia–Ukraine hostilities remain relevant to energy and agricultural trade routes.
(Bloomberg)
Week ahead
- Wed, Oct 28 FOMC decision: The Fed announces its policy decision at 2:00 p.m. ET, followed by a press conference. With energy-driven inflation running hot, markets will focus on whether the Fed signals further tightening; a more hawkish tone could pressure duration and risk assets, while a cautious tone could ease rate-hike expectations.
- Thu, Oct 29 GDP: The BEA releases its advance estimate of Q3 GDP. A stronger reading could support growth-sensitive assets while putting upward pressure on yields; a weaker print could increase demand for duration, depending on its implications for inflation and Fed policy.
- Thu, Oct 29 Personal Income and Outlays: September PCE inflation and consumer-income data will help shape the inflation and demand outlook. Firmer inflation could reinforce expectations of further Fed tightening, while softer readings could ease rate-hike expectations.
- Fri, Oct 30 Employment Cost Index: Q3 compensation data will provide another test of labor-cost pressures. Faster growth could reinforce concerns about persistent inflation, while slower growth could signal easing wage pressures.
- Hyperscaler earnings: Microsoft and Alphabet report Wednesday, followed by Amazon on Thursday. Investors will scrutinize AI capital expenditure, cloud demand, monetization and expected returns. Higher spending without convincing evidence of future returns could pressure technology valuations, while stronger demand and clearer monetization could ease concerns about the sustainability of the AI investment cycle.
Crypto Highlights
OKX-ICE’s proposed tokenized stock listings drew objections from nine public companies on Oct. 19, then Alphabet, Microsoft and Goldman Sachs were reported among objectors on Oct. 20, before Wells Fargo and five others joined by Friday. The SEC innovation exemption process now has 22 company objections on file.
The OCC finalized GENIUS Act rules for payment stablecoin issuance, reserves, redemptions and some custody activities, effective mid-January, and Treasury Secretary Bessent called the act a “watershed moment for American finance.” The American Bankers Association is now objecting to the OCC’s finalized rules, arguing they undermine Congress’s yield provisions.
Wallets linked to Drift’s $295 million April 1 hack sent $109 million in Ether to Tornado Cash over two days, including another $46 million after a $61 million transfer was reported earlier in the week. The wallets now hold $92 million in Ether, after Mandiant attributed the hack to a North Korean threat group.
US spot Bitcoin ETFs drew $527 million on Monday, led by BlackRock’s IBIT with $665.2 million, and reached $1.08 billion over three trading sessions before $635 million was withdrawn Thursday. October now stands at $175 million in net outflows for US spot Bitcoin ETFs.
HSBC launched a Hong Kong dollar stablecoin for retail payments, rolling out RedCoin wallets to PayMe users and outlining support for tokenized investment subscriptions. The rollout is now focused on PayMe users, with institutional uses planned next.
US Spot ETF Flows
| Fund | Weekly Net Flow | Cumulative Inflow | AUM |
|---|---|---|---|
| BTC Spot ETF | +$442.7M | +$57,320.8M | $104.71B |
| ETH Spot ETF | $-225.0M | +$12,714.9M | $14.57B |
| SOL Spot ETF | $-17.3M | +$1,540.1M | $1.61B |
Spot ETF Daily Flows — BTC, ETH & SOL
Cost Basis Distribution & Liquidation Exposure
BTC
ANALYST INTERPRETATION — BTC
1. Positioning & Derivatives Read
$266M of BTC perp longs were liquidated this week, versus $118M of BTC perp shorts, so realised damage was concentrated on leveraged BTC longs. The BTC long/short liquidation ratio was 2.25: more BTC longs were liquidated than shorts this week. BTC ETF demand still absorbed capital, with $443M of BTC net inflows from Mon Oct 19 to Thu Oct 22, so the BTC drawdown was not matched by institutional flow capitulation. BTC spot fell 3.45% on the week from Oct 19 to Oct 26, which means positive BTC ETF demand coexisted with forced BTC long deleveraging rather than broad BTC cash-market exit. BTC positioning remains over-extended on the long side going into next week, and the LONG side is more exposed with $413M of BTC long liquidation exposure within 10% below BTC spot versus $136M of BTC short liquidation exposure above BTC spot.
2. Key Risks & Levels for Next Week
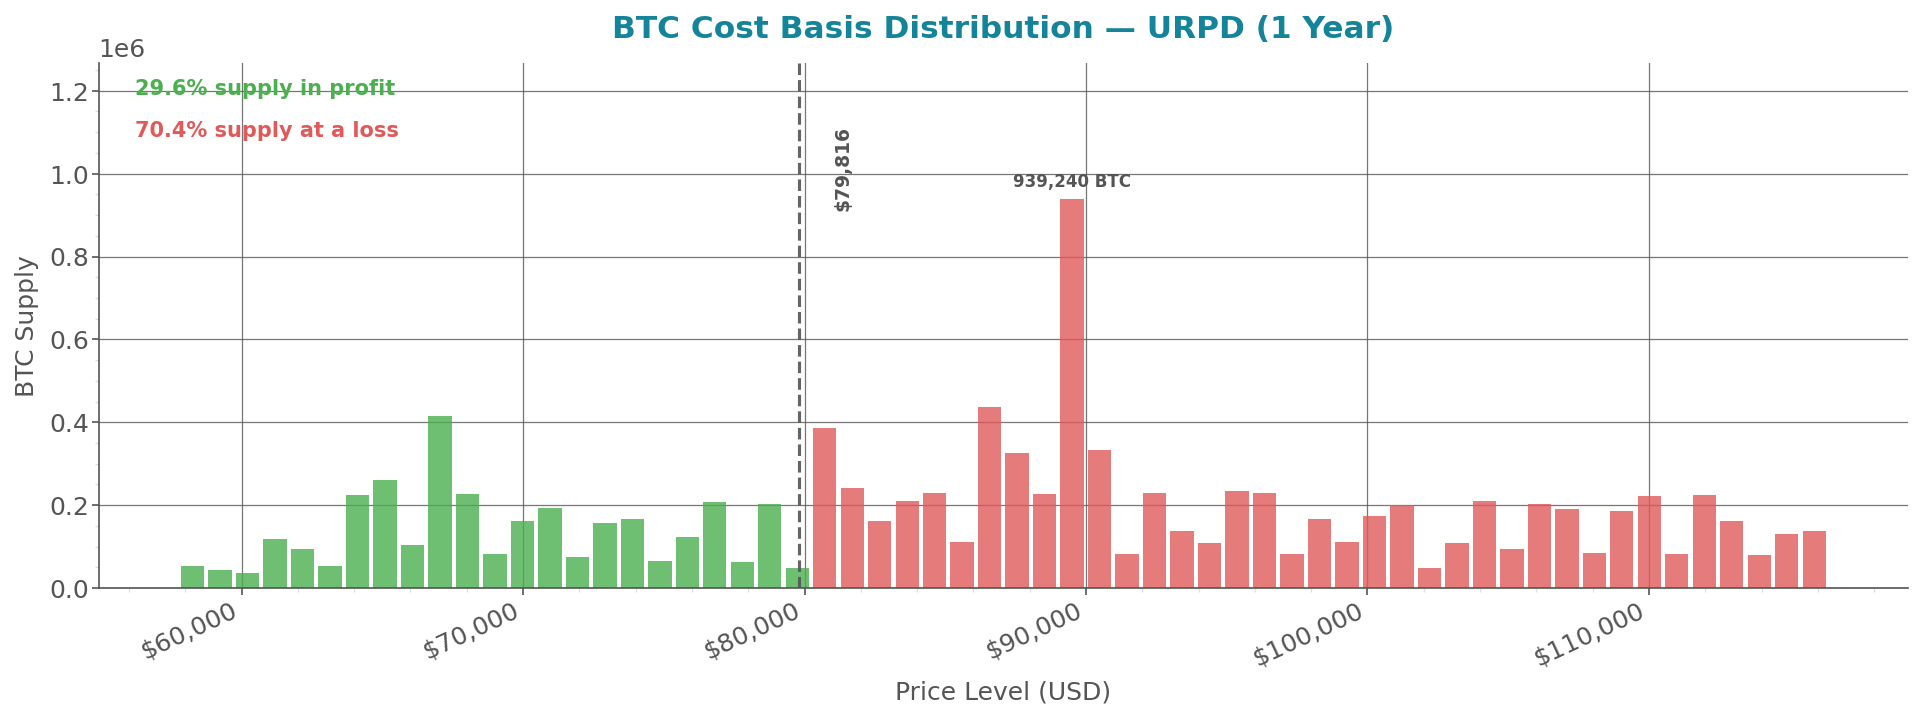
Near-Term Long Liquidation Risk: BTC spot is sitting above the nearest BTC long liquidation shelf at $78,400, where $58.8M of BTC longs are exposed, and above $77,000, where another $76.2M of BTC longs are exposed. The nearby BTC cost-basis cluster at $77,301 holds 172,037 BTC, so liquidation pressure into that zone would meet a meaningful holder-cost area rather than empty air. Watch for BTC perp long liquidations accelerating while BTC spot volume rises on down-ticks and BTC ETF flows turn negative.
Overhead Supply Absorption Risk: BTC spot faces the nearest major cost-basis cluster above current price at $80,260, where 258,022 BTC has cost basis, with nearby BTC short liquidation exposure at $81,200 totaling $15.7M. A push into that area tests whether BTC ETF inflows are strong enough to absorb supply from holders getting back to cost while also pressuring shorts. Watch for BTC spot volume expanding into the level with BTC ETF flows staying positive and BTC options skew shifting toward calls.
Deeper BTC Long Cascade Risk: If BTC selling pressure extends beyond the first liquidation shelf, the next BTC long liquidation bands at $72,800 and $70,700 carry $73.0M and $122.8M of BTC long exposure. Below that, BTC cost-basis supply thickens at $67,241 with 174,107 BTC and $66,649 with 242,166 BTC, making that zone the larger structural downside magnet if forced selling persists. Watch for BTC perp liquidation rates rising before BTC spot reaches the lower bands, because that would show leverage being removed by execution pressure rather than orderly de-risking.
ETH
ANALYST INTERPRETATION — ETH
1. Positioning & Derivatives Read
ETH perp liquidations were long-led this week, with $237M of ETH perp longs liquidated against $124M of ETH perp shorts. ETH’s long/short liquidation ratio was 1.92: more longs were liquidated than shorts this week. ETH perp liquidations peaked on Saturday Oct 24 at $102M total, and the final day still showed pressure on ETH longs, with $17M of ETH perp longs liquidated versus $7M of ETH perp shorts and a 2.48 ratio.
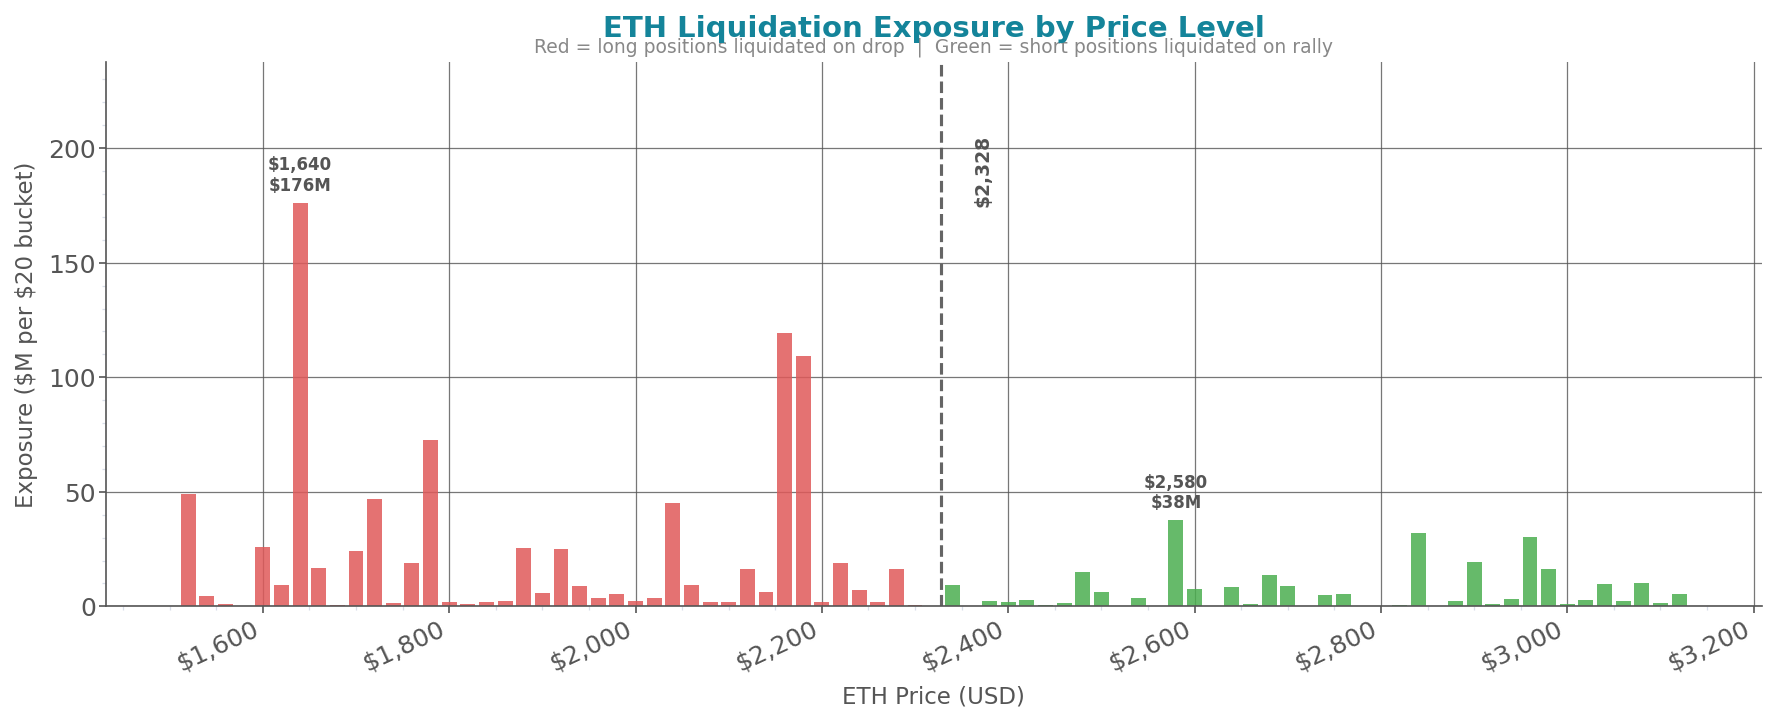
ETH ETF flows reinforced the de-risking read, with ETH funds losing $225M from Mon Oct 19 to Thu Oct 22 against $14.6B of AUM and $12.7B of cumulative flows. ETH fell 4.90% on the week from Mon Oct 19 to Mon Oct 26, and the liquidation mix says the drawdown punished leveraged longs more than shorts. ETH positioning is over-extended on the long side going into next week, with the LONG side more exposed: $300M of ETH long exposure sits below ETH spot within 10% versus $43M of ETH short exposure above.
2. Key Risks & Levels for Next Week
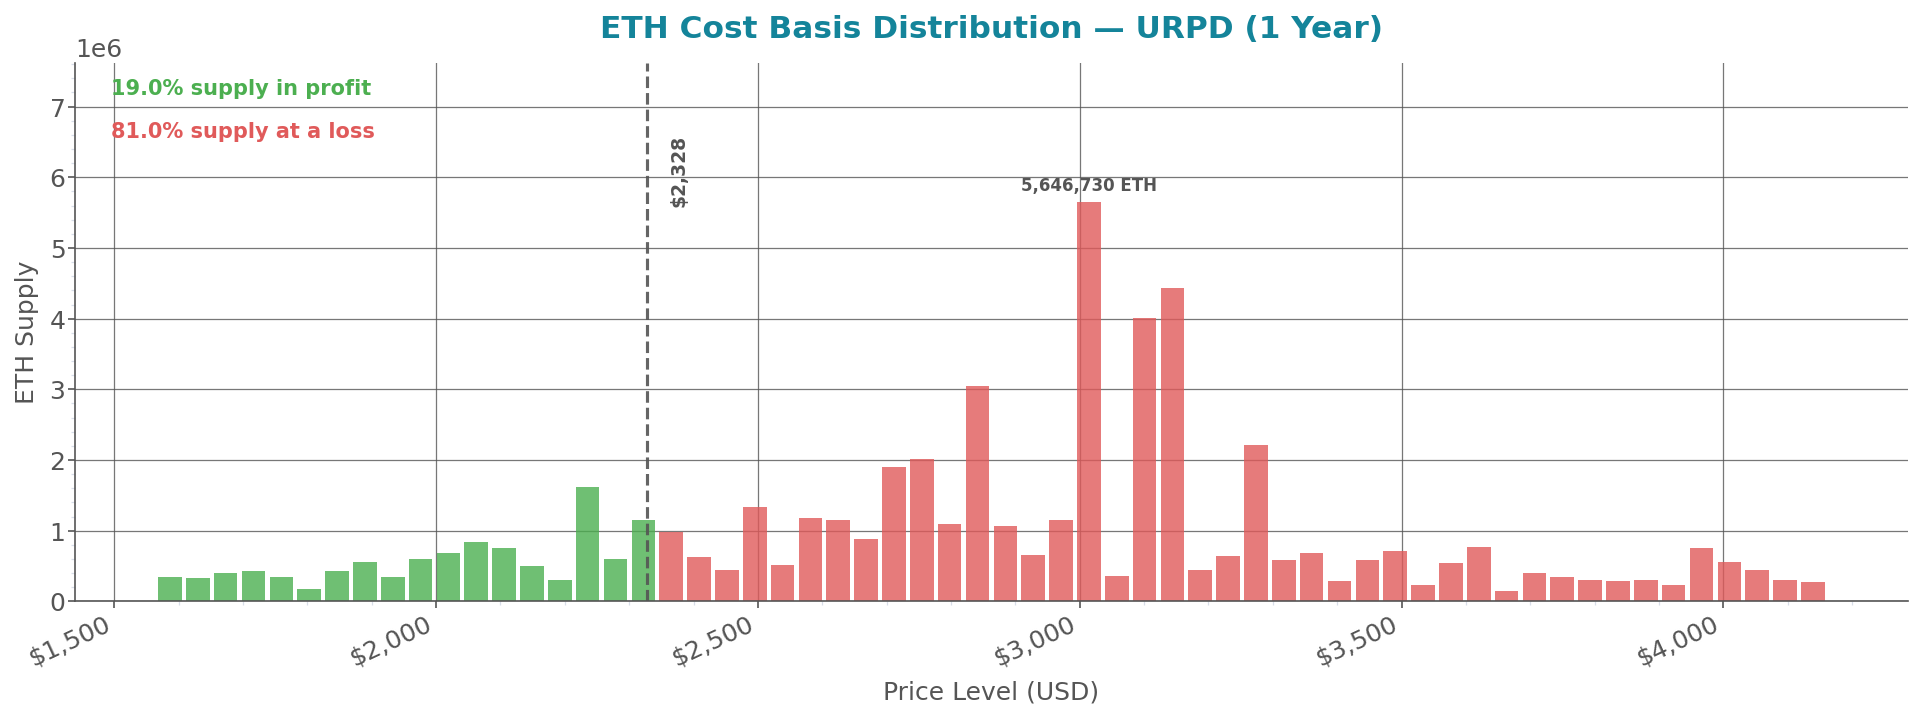
Long Liquidation Cascade: ETH has the larger near-term cascade risk below ETH spot, with $109.1M of ETH longs at $2,180 and $119.5M of ETH longs at $2,160. The key cost-basis shelf above that liquidation band is $2,247, where 1,415,752 ETH last moved, so failure to absorb selling before that shelf leaves ETH exposed to forced long liquidation below. The tell is ETH spot sell volume rising while ETH perp long liquidation rates accelerate and ETH ETF flows stay negative.
Immediate Short-Covering Squeeze: ETH shorts begin getting liquidated close above ETH spot, with $9.5M of ETH shorts at $2,340, $14.8M at $2,480, and $6.2M at $2,500. That band is small relative to the downside long exposure, but it is the nearest fuel for a mechanical ETH rally if ETF flows flip positive and ETH perp shorts start covering. The tell is ETH call skew firming while ETH spot volume expands into the $2,340 to $2,500 short-liquidation zone.
Overhead Supply Absorption: ETH’s first large resistance cluster above ETH spot sits at $2,824, where 1,997,548 ETH has cost basis, and the largest overhead cluster is $3,033, where 5,121,876 ETH has cost basis. ETH also has larger short liquidation fuel higher up at $3,420 with $72.9M of ETH shorts, so a rally that reaches supply without accelerating short liquidations risks stalling into holder distribution. The tell is ETH spot volume weakening into overhead cost basis while ETH ETF inflows fail to expand and ETH options skew stops moving toward calls.
On-Chain Signals — Bitcoin
| Signal | Week-End | Week Chg | Reading |
|---|---|---|---|
| MVRV Ratio | 1.512 | -2.3% | Moderate gains phase |
| NUPL | 0.341 | -4.9% | Optimism |
| Exch. Net Flow (week total) | +6,068.1 BTC | +1,165.8 BTC | Net inflows — distribution |
| Exchange Balance (USD) | $269.32B | -2.0% | |
| Perp Funding Rate | +0.00507% | -0.00382pts | Near-neutral |
| Perp Open Interest | $35.17B | +0.3% | |
| 1M Implied Vol | 36.6% | +0.5pts | Low vol environment |
| 25Δ Put/Call Skew | 13.2% | +4.0pts | Slight downside bias (puts bid) |
| Realized Vol (1W) | 29.2% | +5.3pts | Moderate |
| DVOL Index | 38.8 | +3.9% | |
| Accumulation Balance | 2,006,925 BTC | -0.3% | |
| Supply Held ≥100k BTC | 696,799 BTC | +0.0% | |
| Net Realized P/L (week total) | +$3,845.4M | +$3,115.8M | Coins moved at a profit |
Amber rows deviate >1.5σ from prior 4-week baseline • data as of 2026-10-25
MVRV fell 2.3% to 1.512 and NUPL dropped 4.9% to 0.341, now 2.6σ below its 4-week baseline. Derivatives show limited leverage stress: OI rose 0.3% to $35.17B but options are paying for downside with 25Δ skew at 13.2% (+4.0pts, 2.8σ high), 1M IV at 36.6%, and DVOL at 38.8. The standout anomaly is distribution pressure: spot CVD is 2.9σ below baseline, net realized P/L hit +$3.845B, and Friday exchange inflows spiked +11,156.6 BTC.
Weekly Market Wrap
The week’s defining pattern was a divergence between large-cap growth stocks and the broader equity market, rather than a uniform sell-off. From the October 16 close to October 23, the Nasdaq Composite fell 0.71% and the S&P 500 fell 0.47%, while the Dow Jones Industrial Average rose 0.41% and the Russell 2000 rose approximately 2.00%. The VIX fell from 19.99 to 19.45, down 0.54 points over the week. Treasury yields also declined over the period, with the 10-year yield down 9 basis points and the 30-year yield down 10 basis points. Crypto assets weakened into Monday, October 26.
US equities were pressured by renewed concerns about the returns on AI investment, weakness in communication services and inflation risks associated with higher energy prices. Communication services was among the weakest S&P 500 sectors, while health care, energy and utilities recorded positive weekly returns in sector-market data. WTI crude rose over the week as geopolitical risks supported prices, while gold declined and the dollar index was broadly little changed. These moves reflected competing forces: concerns about energy-driven inflation and interest rates on one side, and demand for defensive or value-oriented exposures on the other. US jobless claims, UK inflation, Japanese core inflation and French fiscal and political developments also featured in the macroeconomic backdrop. International equities were mixed, with losses across several major European and Asian markets, underscoring that the week's divergence was not confined to the United States.
Crypto markets faced a more difficult combination of price weakness, uneven institutional flows and security concerns. From October 19 through October 22, US spot Bitcoin ETFs recorded approximately $439 million in net inflows, while spot Ether ETFs experienced approximately $225 million in net outflows. Bitcoin's weekly flow total concealed substantial volatility: after strong inflows early in the period, the funds recorded a net outflow of $635.6 million on October 22. US spot Solana ETFs also recorded net outflows over the same four-session window. The institutional story continued to centre on stablecoin and tokenization infrastructure, including JPMorgan's launch of its deposit token on Ethereum and the expansion of Singapore's BLOOM initiative to Malaysia and Thailand. Regulatory developments included the OCC's final stablecoin rule under the GENIUS Act and new FCA consultations concerning decentralized finance and the UK cryptoasset framework. Security remained a concern: the Ethereum Foundation postponed the Glamsterdam upgrade on the Hoodi testnet to investigate interactions involving EIP-8037, while reports also described an Initia security incident and a breach affecting Keystone website customers. These developments highlight both continued institutional investment in digital-asset infrastructure and the operational, regulatory and security risks facing the sector.
This week’s first major macro catalyst is the Federal Reserve’s policy decision on Wednesday, October 28. Investors will be watching the policy statement and press conference for guidance on inflation, energy prices and the interest-rate outlook. The second is the earnings outlook for large technology companies, as investors continue to assess whether AI-related capital expenditure can generate sufficient returns to justify elevated valuations. In crypto, the focus will be on whether ETF flows broaden beyond Bitcoin after the divergent flows into Bitcoin and Ether funds, alongside any revised timetable for Ethereum’s delayed Glamsterdam Hoodi testnet upgrade.