
WEEKLY MARKET DIGEST • October 05 – October 12, 2026
TLDR
- Crypto liquidations totaled $1.1B after Bitcoin speculators moved 55,000 BTC to exchanges.
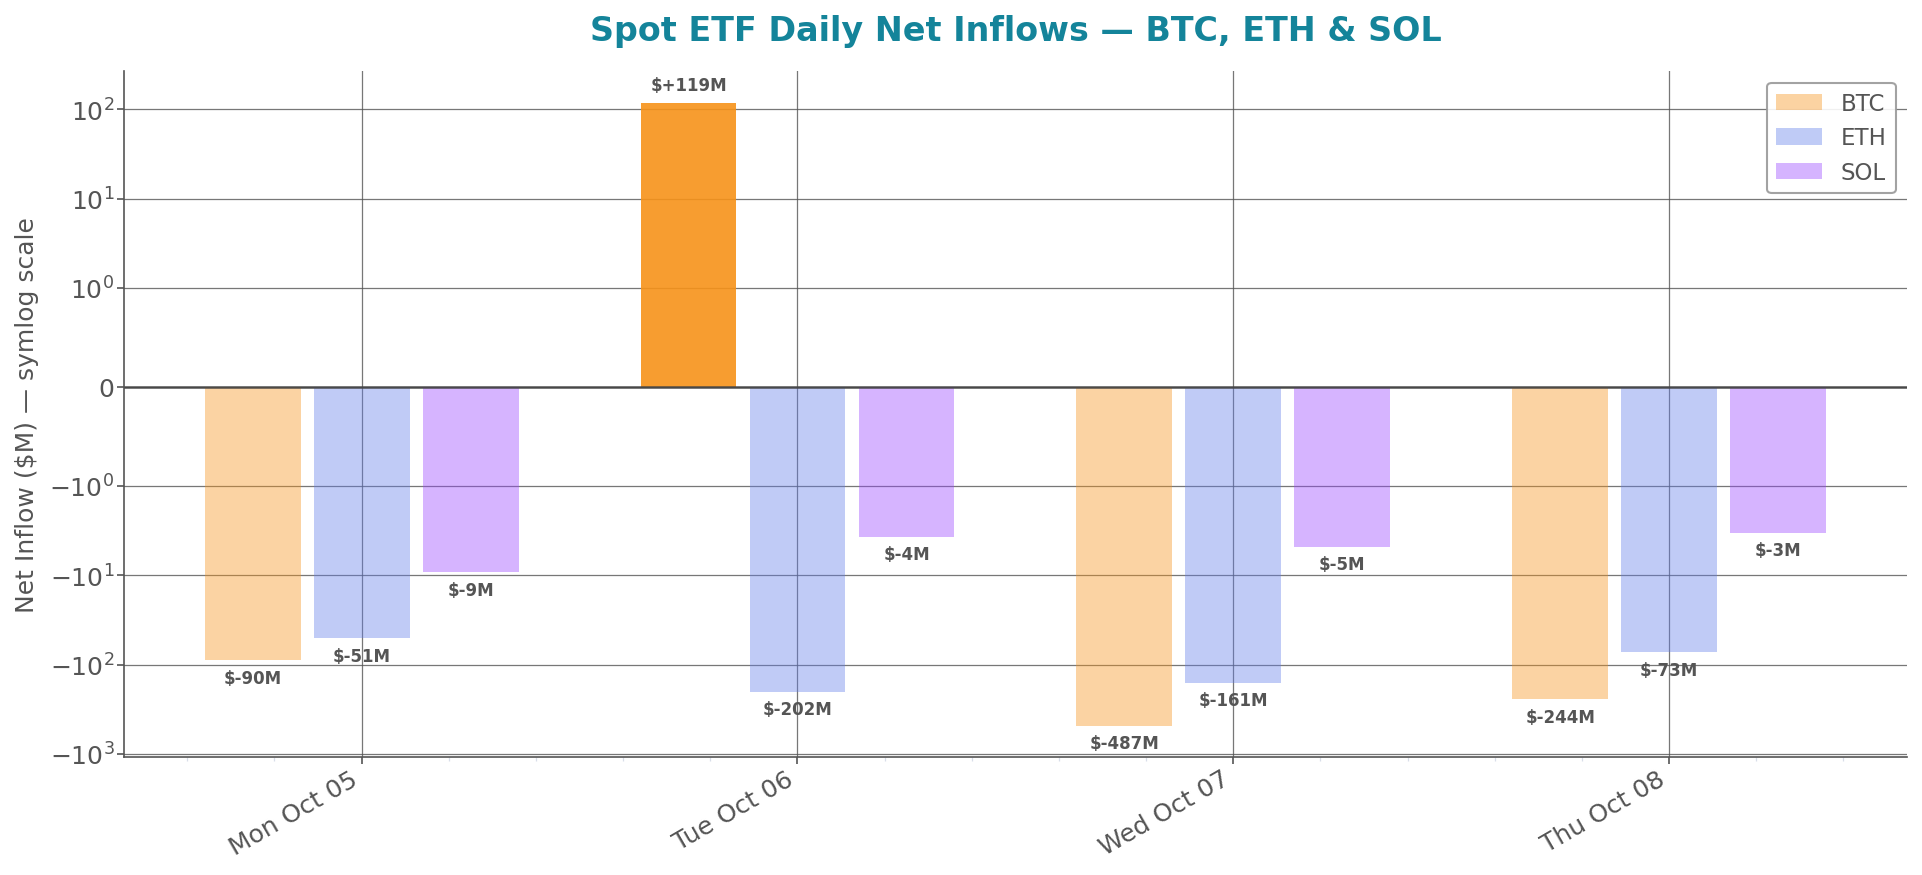
- Spot crypto ETFs recorded $702M BTC, $486M ETH and $21M SOL outflows from Oct 5 to Oct 8.
- Ethereum fell 5.46% over the week from Oct 5 to Oct 12.
- Next week, ETH $2,300 carries $106.3M long liquidation exposure below cost-basis shelves at $2,351 and $2,324.
Weekly Market Performance
| Asset | Week Open | Week Close | Weekly Change | 1M Change |
|---|---|---|---|---|
| Global Crypto Market Cap | $2.92T | $2.84T | -2.88% | — |
| S&P 500 | 7,722.72 | 7,811.54 | +1.15% | +2.02% |
| Dow Jones | 51,176.96 | 51,654.95 | +0.93% | -1.75% |
| Nasdaq | 27,190.86 | 27,366.17 | +0.64% | +3.92% |
| VIX | 15.31 | 14.84 | -0.47pp | -1.00pp |
| Bitcoin (BTC) | $85,817 | $83,923 | -2.21% | +8.64% |
| Ethereum (ETH) | $2,711 | $2,563 | -5.46% | +1.98% |
Macro Highlights
CPI 3.4% y/y Aug · Core CPI 2.4% y/y Aug · Core PCE 3.0% y/y Aug · Unemployment 4.2% Sep · Payrolls +29k m/m Sep · Real GDP +1.5% q/q annualized Q2
Energy and Inflation
The market’s message is that energy relief is not energy clearance. WTI rose roughly 1% and Brent 2% last week, as the Russian diesel announcement failed to remove the broader energy risk premium. On Fri Oct 09, Trump announced that Russia would supply 300,000 metric tons of diesel immediately, followed by 500,000 tons in November and further deliveries thereafter. The proposed volumes could ease refined-product tightness at the margin, but Russia’s damaged refining infrastructure and uncertainty over delivery capacity limit the near-term relief. Meanwhile, continued Middle East tensions leave the upside risk to energy prices intact. The key transmission channel remains inflation: sustained fuel-price pressure could feed into transport and goods costs, complicating the rates outlook. With September CPI due Wednesday and PPI on Thursday, the next test is whether energy pressures are passing through to broader prices. Financial Times · Reuters
Growth and Inflation
US activity remains resilient, but the mix is increasingly uncomfortable for monetary policy. ISM Services eased to 54.9 from 55.4, remaining in expansion territory, while employment and prices increased and respondents continued to flag tariff and fuel costs. Atlanta Fed GDPNow edged down to 3.6% from 3.8%, suggesting some moderation without signaling a clear growth downturn. The combination of firm activity and persistent cost pressures leaves room for inflation to remain sticky even as momentum cools. This week’s CPI, PPI and retail-sales releases should help establish whether demand is holding up strongly enough to sustain pricing pressure or beginning to soften.
Dollar and Rates
Dollar strength is extending beyond the weekly rates move. DXY recorded its fourth consecutive weekly gain, breaking above 102 even as US Treasury yields stabilized and finished modestly lower. The divergence suggests that relative monetary-policy expectations and geopolitical demand are contributing alongside yield differentials. The dollar’s momentum remains supported by uncertainty abroad, while the coming inflation data will test whether renewed US rates pressure provides an additional leg to the move. A softer inflation outcome could temper the rates channel, but would not necessarily reverse dollar strength if geopolitical risk and relative growth continue to favor the greenback.
France: Sovereign Stress
French fiscal risk remains an important euro-area pressure point, although the late-week pullback in yields eased some immediate concerns. On Mon Oct 05, France’s 10-year yield premium over Germany widened sharply amid political uncertainty and concerns about the fiscal outlook. Banque de France Governor Emmanuel Moulin warned that France risked being “strangled by interest rates,” highlighting the danger of rising debt-servicing costs further constraining fiscal choices. By Friday, French yields had retreated, particularly at the short end, offering some relief after the selloff. The main transmission channel remains the euro: renewed spread widening could weigh on EUR sentiment without necessarily triggering a broader global flight to safety. With US inflation data ahead, the interaction between French sovereign risk and the US rates differential remains key for EUR/USD. Reuters · Financial Times
Week ahead
- Wed Oct 14: Consumer Price Index: September CPI is due at 8:30 a.m. ET. A print below August's +3.4% y/y and +0.4% m/m (seasonally adjusted) would support the disinflation/lower-rates channel, while an acceleration, particularly in energy-related components, could put renewed upward pressure on Treasury yields.
- Thu Oct 15: Advance Monthly Sales for Retail and Food Services: September retail sales are due at 8:30 a.m. ET. August sales stood at $773.9bn, up 1.2% m/m. A decline in September sales would weaken the nominal US-demand signal, although headline sales are not adjusted for price changes.
- Thu Oct 15: Producer Price Index: September PPI is due at 8:30 a.m. ET. August final-demand PPI rose 5.4% y/y and 0.4% m/m (seasonally adjusted). A further acceleration, especially in energy-sensitive goods, would strengthen the case for producer-price pass-through and renewed rates pressure.
- Fri Oct 16: Industrial Production and Capacity Utilization (G.17): September data are scheduled for 9:15 a.m. ET. August industrial production was unchanged m/m at the published precision and 1.4% above its year-earlier level. A monthly contraction would shift the risk focus toward weakening industrial activity and growth.
Crypto Highlights
Ledger confirmed an unauthorized hardware implant incident tied to reseller CryptoBilis in Southeast Asia, with researchers estimating suspected losses between $72 million and more than $86 million. The company says the issue appears isolated to a single reseller and remains under investigation.
The XRP Ledger Foundation defended an emergency security patch for a critical “unlimited XRP” vulnerability that researchers said could have enabled arbitrary token creation.
The CFTC proposed two measures aimed at separating federally regulated prediction markets from casino gambling, after Blockchain.com reportedly applied for two CFTC licenses and the NFL backed New Jersey’s Supreme Court petition against Kalshi.
ESMA gave EU crypto firms three months to exit stablecoins that do not comply with MiCA, urging them to halt services involving unauthorized stablecoins and address existing exposures.
US Bitcoin ETFs lost $244 million on Thursday while Ether funds shed $641 million, after earlier October withdrawals included a $485 million Bitcoin ETF outflow, the largest daily withdrawal since June. Ether ETFs are now on an eight-session outflow streak, with combined Bitcoin and Ether ETF outflows approaching $1 billion.
Cost Basis Distribution & Liquidation Exposure
BTC
ANALYST INTERPRETATION — BTC
1. Positioning & Derivatives Read
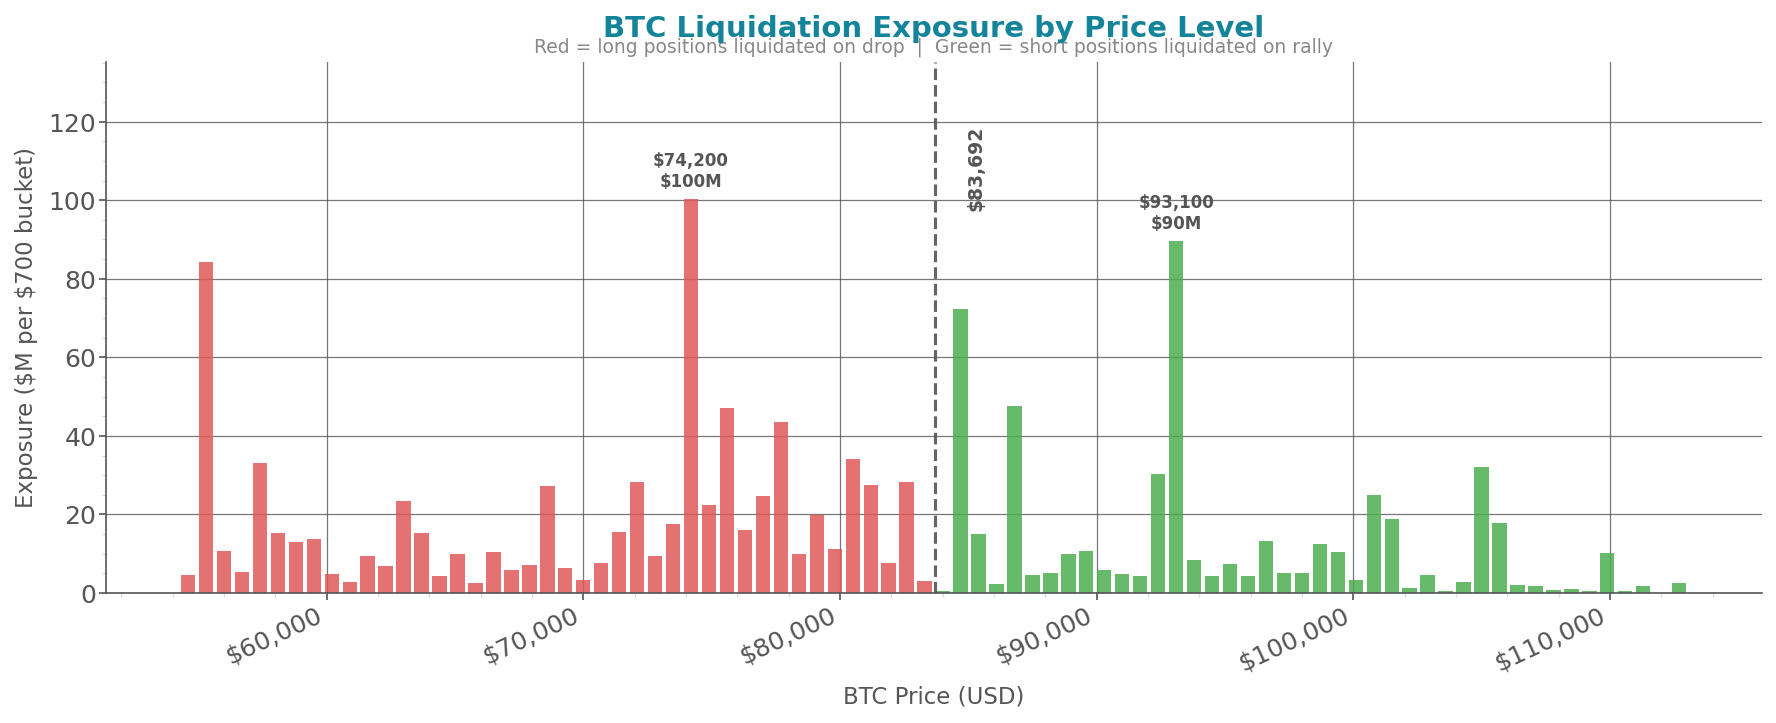
BTC fell 2.21% on the week from Mon Oct 05 to Mon Oct 12, while BTC ETF net outflows were $702M from Mon Oct 05 to Thu Oct 08. $369M of BTC perp longs and $87M of BTC perp shorts were liquidated over the week, and the week-total long/short liquidation ratio was 4.22, meaning more BTC perp longs were liquidated than BTC perp shorts. The BTC read is that levered long positioning absorbed the damage while ETF demand was negative, so the selloff was a long-deleveraging event rather than a short-covering event. BTC market positioning is still over-extended to the long side, and BTC longs are the more exposed side going into next week because the on-chain exposure line puts $273M of BTC longs below BTC spot versus $183M of BTC shorts above BTC spot.
2. Key Risks & Levels for Next Week
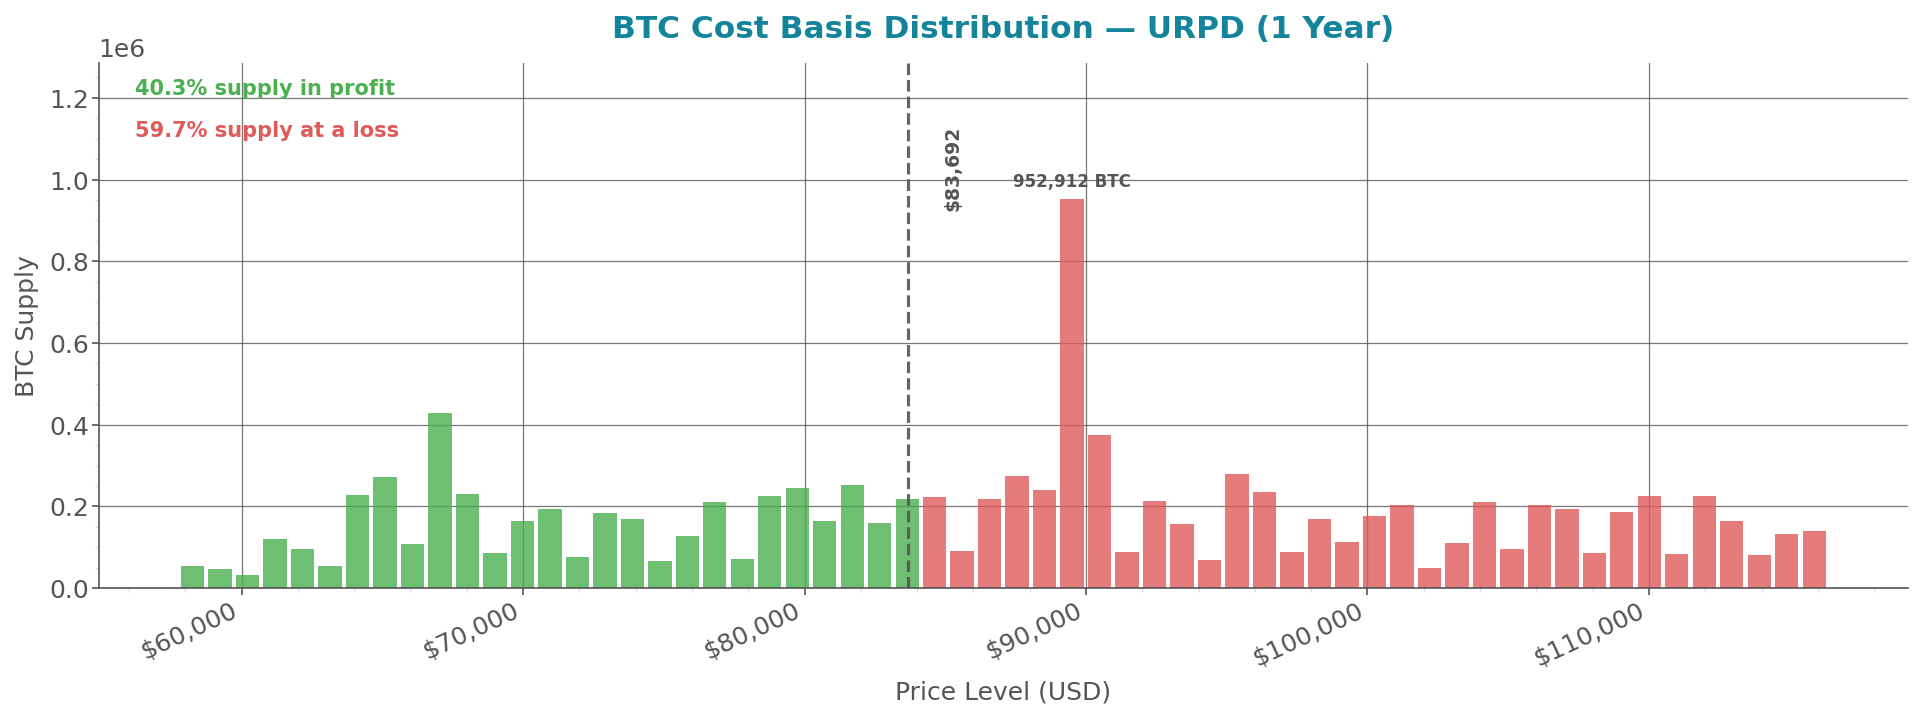
Long Liquidation Cascade: BTC has a cost-basis shelf at $79,668 with 245,606.93 BTC, and the next BTC perp liquidation bands below are $75,600 with $47.1M of longs and $74,200 with $100.2M of longs. BTC downside risk is active if BTC spot volume builds into $79,668 while BTC perp long liquidations accelerate and BTC ETF flows remain negative.
Near-Spot Short Squeeze: BTC $84,700 carries $72.3M of shorts, making it the nearest BTC liquidation pocket above BTC spot. BTC squeeze risk is active if BTC ETF flows turn positive, BTC spot volume expands on upticks, and BTC perp short liquidation rates accelerate before BTC spot reaches $84,700.
Overhead Supply Rejection: BTC overhead supply starts at $88,546 with 240,760.37 BTC and thickens at $89,137 with 353,583.04 BTC and $89,729 with 599,329.16 BTC. BTC rejection risk is active if BTC spot volume fades into those cost-basis clusters while BTC ETF flows stay negative and BTC options skew shifts away from calls.
ETH
ANALYST INTERPRETATION — ETH
1. Positioning & Derivatives Read
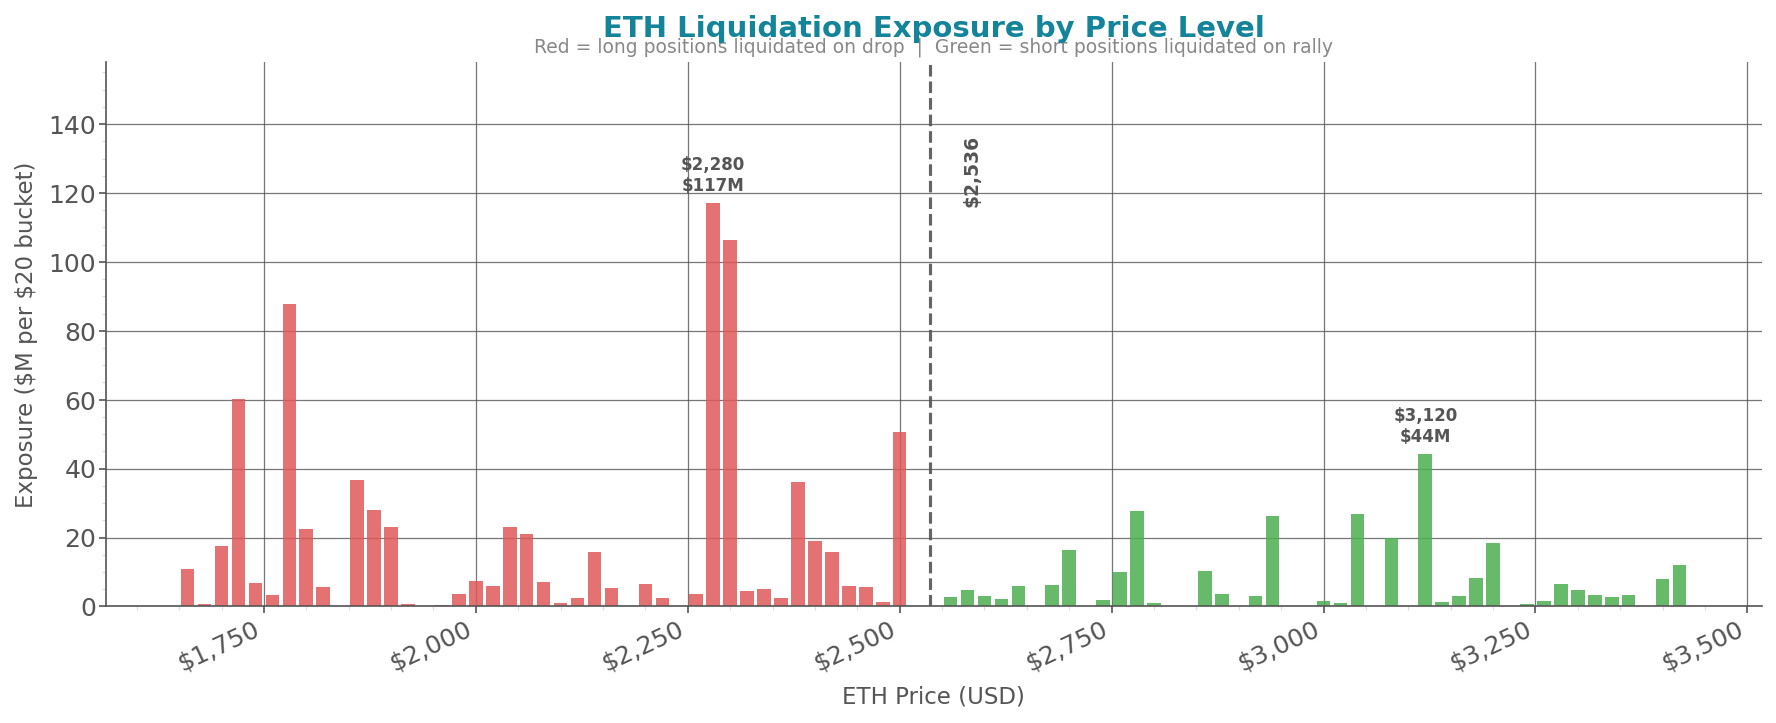
ETH price fell 5.46% on the week, and ETH ETF demand confirmed distribution with $486M of net outflows, reducing the bid from regulated spot vehicles while ETH AUM stood at $15.6B against cumulative flows of $13.3B. ETH perpetual futures positioning was hit on the long side: $363M of ETH perp longs were liquidated versus $81M of ETH perp shorts, and the reported week-total long/short liquidation ratio was 4.50, meaning more longs were liquidated than shorts this week. ETH perp stress peaked on Thursday with $224M of total liquidations, while Sunday’s $6M of long liquidations versus $15M of short liquidations shows late-week pain was no longer exclusively long-side. ETH positioning remains over-extended on the long side because forced selling has already hit longs, ETF flows are negative, and the next-week heatmap still leaves the LONG side more exposed, with $357M of longs below ETH spot versus $81M of shorts above ETH spot.
2. Key Risks & Levels for Next Week
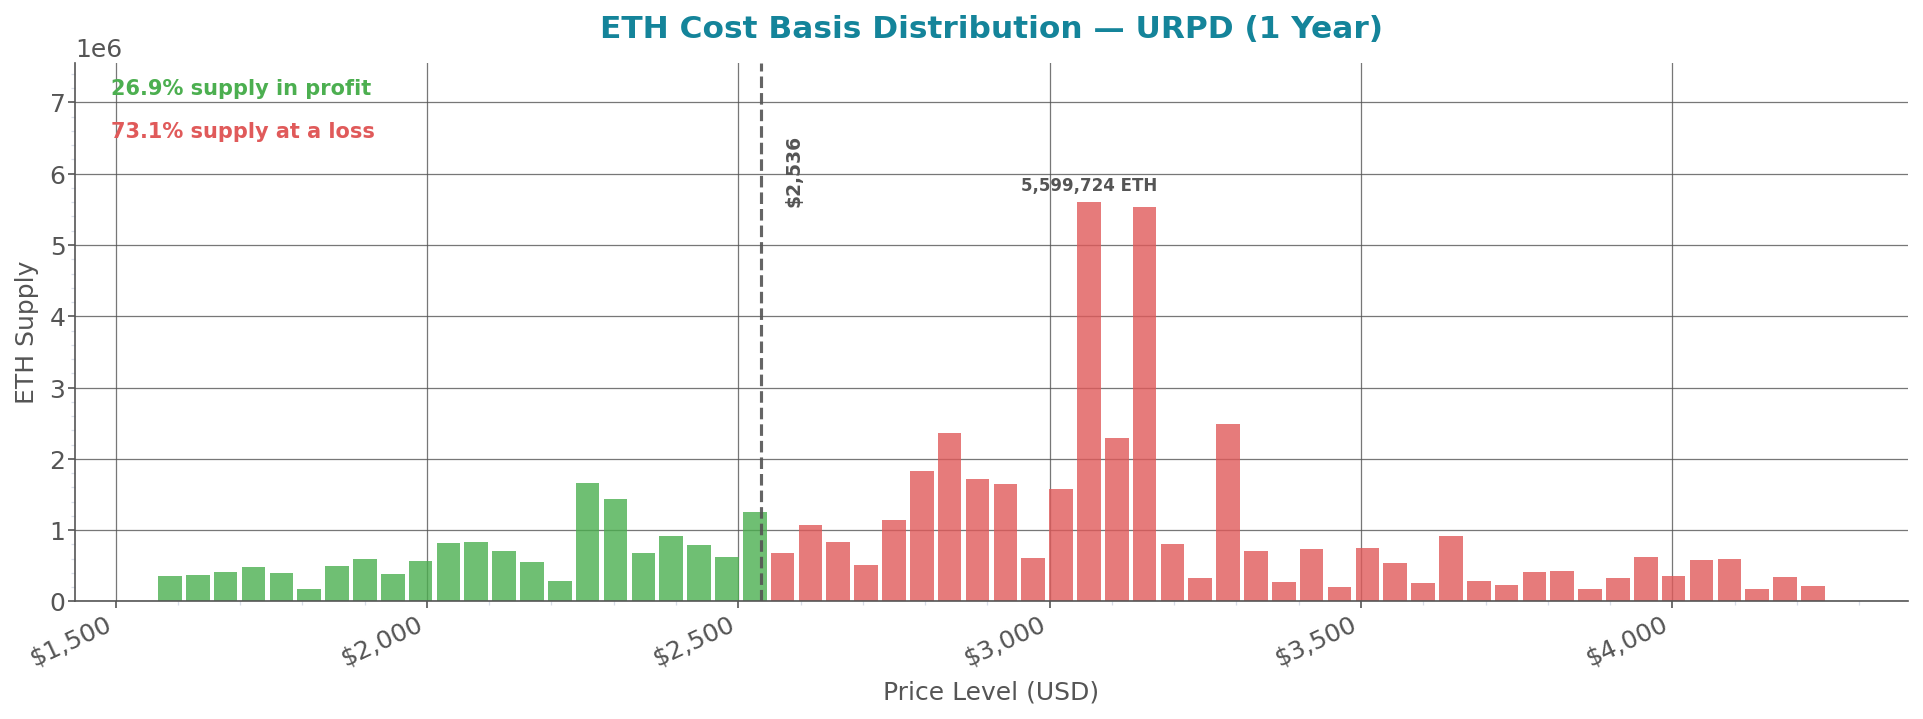
Long Liquidation Risk: ETH $2,300 carries $106.3M of long liquidation exposure, and it sits below ETH cost-basis shelves at $2,351 with 672,382.97 ETH and $2,324 with 1,060,070.75 ETH, so a push through those holder bases puts the first major perp long band in play. The signal is ETH spot selling volume expanding while ETH perp long liquidations accelerate and ETH ETF flows remain negative.
Deeper Downside Cascade: ETH $2,280 carries $117.1M of long liquidation exposure, the largest listed long band below ETH spot, and the next cost-basis shelf below is ETH $2,242 with 1,434,151.32 ETH. The signal is ETH perp funding and options skew shifting defensively while liquidation prints cluster faster around the ETH long side rather than clearing in isolated bursts.
Short Squeeze Risk: ETH $3,120 carries $44.1M of short liquidation exposure and sits inside heavy overhead cost-basis congestion around ETH $3,110 with 2,291,314.53 ETH and ETH $3,137 with 2,210,003.31 ETH. The signal is ETH spot volume rising into that supply zone while ETH ETF flows turn positive and ETH perp short liquidations begin to dominate the tape.
US Spot ETF Weekly Flows
| Fund | Weekly Net Flow | Cumulative Inflow | AUM |
|---|---|---|---|
| BTC Spot ETF | $-702.2M | +$57,107.0M | $104.91B |
| ETH Spot ETF | $-486.0M | +$13,315.9M | $15.64B |
| SOL Spot ETF | $-21.1M | +$1,586.7M | $1.74B |
Spot ETF Daily Flows — BTC, ETH & SOL
On-Chain Signals — Bitcoin
| Signal | Week-End | Week Chg | Reading |
|---|---|---|---|
| MVRV Ratio | 1.585 | -2.6% | Moderate gains phase |
| NUPL | 0.374 | -4.3% | Optimism |
| Exch. Net Flow (week total) | +514.6 BTC | +27,051.2 BTC | Net inflows — distribution |
| Exchange Balance (USD) | $279.45B | -2.2% | |
| Perp Funding Rate | +0.00390% | +0.00358pts | Near-neutral |
| Perp Open Interest | $34.53B | -2.5% | |
| 1M Implied Vol | 34.5% | +0.6pts | Low vol environment |
| 25Δ Put/Call Skew | 7.1% | +5.1pts | Calls bid — bullish |
| Realized Vol (1W) | 25.4% | +3.7pts | Moderate |
| DVOL Index | 37.34 | +3.4% | |
| Accumulation Balance | 2,015,574 BTC | -0.2% | |
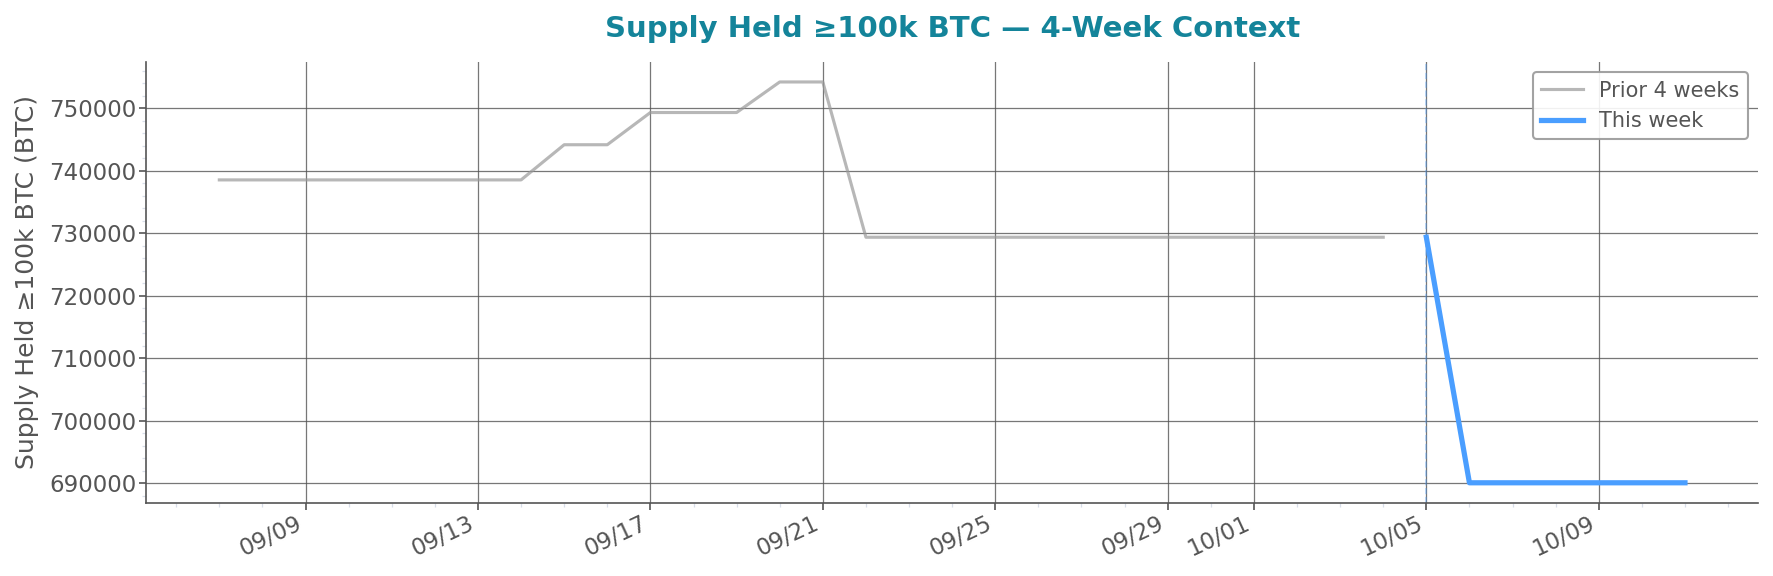
| Supply Held ≥100k BTC | 690,088 BTC | -5.4% | |
| Net Realized P/L (week total) | +$2,605.1M | -$597.5M | Coins moved at a profit |
Amber rows deviate >1.5σ from prior 4-week baseline • data as of 2026-10-11
Notable — Supply Held ≥100k BTC: 5.5σ below 4-week baseline
Notable — 25Δ Put/Call Skew: 2.5σ above 4-week baseline

Bitcoin remains mid-cycle rather than euphoric: MVRV at 1.585 (-2.6% w/w) and NUPL at 0.374 (-4.3%) show profits still positive but cooling, while net realized P/L stayed high at +$2.61B. Derivatives positioning is cleaner but more defensive, with funding at +0.00390%, perp OI down 2.5% to $34.53B, 1M IV up to 34.5%, and 25Δ skew jumping to 7.1% (+5.1pts, 2.5σ). The standout anomaly is supply held by ≥100k BTC wallets falling 5.4% to 690,088 BTC, 5.5σ below baseline, signaling large-holder redistribution alongside modest exchange inflow (+514.6 BTC).
Weekly Market Wrap
The week delivered a split performance across asset classes: from the Oct 2 close to the Oct 9 close, the S&P 500 rose 1.15%, the Dow gained 0.93% and the Nasdaq added 0.64%, while the VIX fell 0.47 points to 14.84. Equities remained resilient despite elevated oil prices, inflation concerns and geopolitical uncertainty, but the headline gains masked considerable dispersion within technology and AI. Microsoft rose 3.39% and Amazon rose 4.34%, while Nvidia dropped 2.00% and Intel dropped 12.26%. This was less a uniform AI rally than a market distinguishing between winners and weaker parts of the semiconductor complex. Friday's rebound followed Trump's assurance that the US would not strike Iran before the midterm elections, which helped ease pressure on oil and yields. The S&P 500 finished near its record close, with the equal-weight index also outperforming.
Rates and cross-asset pricing remained more cautious than equity performance suggested. US Treasury par yields edged lower over the week, with the 5y and 10y down 4bp and the 30y down 3bp. The dollar index rose 0.27%, from 101.93 to 102.21, extending its advance despite the modest pullback in yields, WTI crude gained 0.81% and gold gained 1.30%. The New York Fed's September survey showed one-year inflation expectations rising to 3.9%, their highest since May 2023, while the latest FOMC minutes indicated that most participants viewed another rate increase in 2026 as likely appropriate. The combination leaves markets balancing resilient risk appetite against persistent energy-driven inflation and the prospect of further monetary tightening. Outside the US, the World Bank projected East Asia and Pacific growth of 4.5% in 2026, while European equity performance was mixed, with gains in the Netherlands and UK offset by declines in France, Germany and Italy. AP · New York Fed · World Bank
Crypto underperformed equities, with prices weakening alongside ETF outflows and forced deleveraging. On the Oct 5-12 price snapshot, Bitcoin fell from $85,816.53 to $83,922.83 (-2.21%), Ethereum declined from $2,711.35 to $2,563.20 (-5.46%), and Solana lost 6.95%. US spot ETF flows from Oct 5-8 were negative across all three assets: approximately $700M in net Bitcoin outflows, $486M in Ethereum outflows and $21M in Solana outflows. Selling intensified as Bitcoin briefly fell to $80,350, with more than $1.1bn in crypto liquidations reported over 24 hours. Short-term holders also sent more than 55,000 BTC to exchanges at a loss, consistent with increased selling pressure. Farside Investors · Cointelegraph
Regulatory developments were unusually dense, although the direction was mixed. On Oct 5, the CFTC proposed rules to bring crypto platforms offering leveraged, financed or margined transactions under federal registration and oversight. That same day, FinCEN withdrew its proposed rules covering certain unhosted-wallet transactions and crypto mixing, reversing previously proposed compliance obligations. On Oct 8, ESMA clarified that EU crypto-asset service providers must cease providing services related to non-MiCA-compliant stablecoins, with existing exposures to be remediated as soon as possible and no later than three months after publication of its opinion. Thailand's securities regulator also finalized its crypto ETF framework, with the rules taking effect on Oct 16. The regulatory picture is therefore not uniformly restrictive: US deregulatory measures are arriving alongside tighter EU requirements and new regulated investment-product frameworks in Asia. Reuters · FinCEN · ESMA · Thailand SEC
This week, the central macro question is whether geopolitical announcements translate into actual changes in energy supply. Trump's proposed Russia-Ukraine energy ceasefire remains unconfirmed by both sides, and Russian attacks on Ukrainian energy infrastructure continued after the announcement. Markets will be watching for evidence of compliance and any sustained impact on crude and refined-product prices, rather than treating the announcement itself as a resolution of supply risk. On trade, the EU and China have reached an understanding to limit Chinese hybrid-vehicle exports to Europe; the focus now shifts to implementation, quotas and pricing conditions. In crypto, Thailand's new framework takes effect on Oct 16, creating a regulated route for Bitcoin and Ether ETFs, although the date does not guarantee that individual funds begin trading immediately. US spot ETF flows remain another key signal of whether the recent drawdown is attracting fresh demand or extending the current deleveraging phase. Reuters · Reuters