
WEEKLY MARKET DIGEST • August 10 – August 17, 2026
TLDR
- S&P 500 rose 0.42% to 7,785.76
- VIX fell 7.83% to 14.25
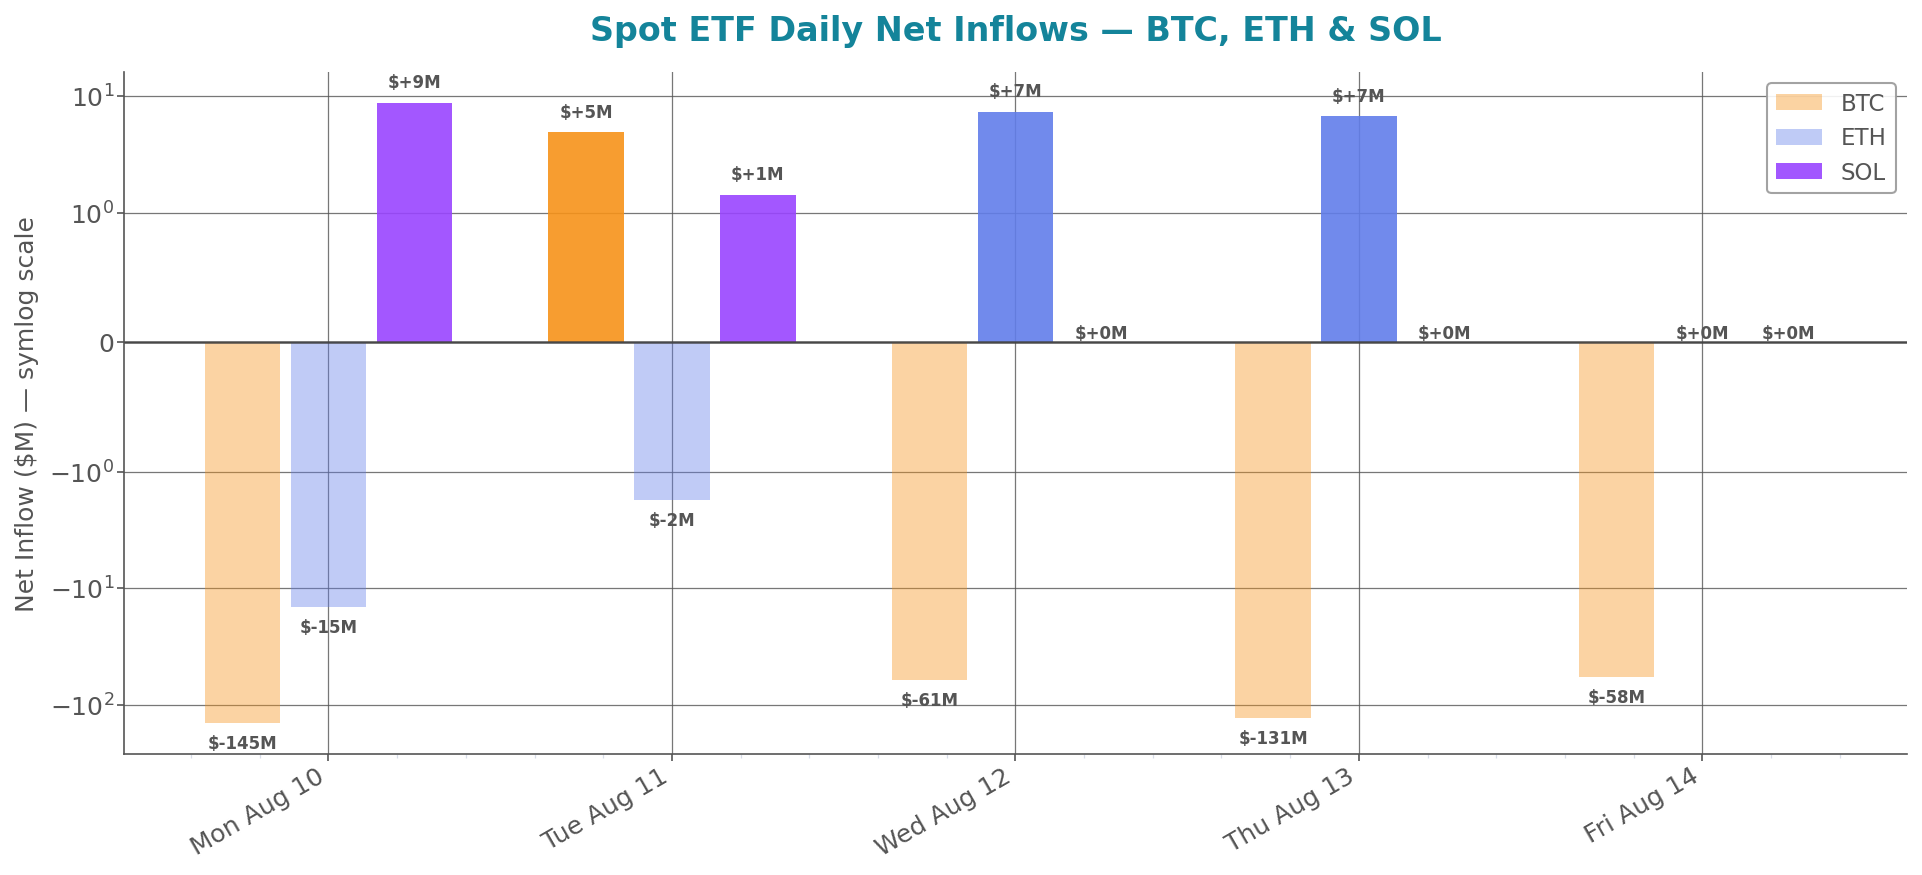
- $390M net outflow from BTC ETFs
- Bitcoin fell 2.48% to $63,530
- Key support level at $61,920 for BTC
Weekly Market Performance
| Asset | Week Open | Week Close | Weekly % | 1M % |
|---|---|---|---|---|
| Global Crypto Market Cap | $2.22T | $2.18T | -1.76% | — |
| S&P 500 | 7,753.11 | 7,785.76 | +0.42% | +4.40% |
| Dow Jones | 53,975.98 | 53,732.41 | -0.45% | +3.04% |
| Nasdaq | 26,605.36 | 26,729.16 | +0.47% | +4.74% |
| VIX | 15.46 | 14.25 | -7.83% | -24.08% |
| Bitcoin (BTC) | $65,148 | $63,530 | -2.48% | -1.95% |
| Ethereum (ETH) | $1,924 | $1,901 | -1.23% | +2.10% |
Macro Highlights
The US and Iran have been engaged in a war of words, with the US preparing fresh economic sanctions and Iran rebuffing claims over the Strait of Hormuz. The situation remains unresolved, with ship attacks mounting in the Strait of Hormuz. As the US vows to cripple Iran's economy, the conflict shows no signs of easing, and its impact on global oil prices and markets continues to be felt. (Bloomberg)
Indian financial institutions have sold a record $8 billion in dollar bonds so far this year, taking advantage of a central bank facility that lowers hedging costs. This development is significant for India's economy and financial markets, as it indicates a growing appetite for Indian debt among international investors. (Bloomberg)
Japan's 10-year yield has risen to its highest level since 1996, driven by speculation about a potential interest rate hike by the Bank of Japan. (Bloomberg)
Emerging-market currencies have risen to a record high, driven by easing bets on a Federal Reserve interest rate hike, suggesting a shift in investor sentiment towards emerging markets and a decreased expectation of monetary policy tightening in the US.(Bloomberg)
Global shipping costs have surged due to war and climate change, with rates on key routes such as the Panama Canal, Rhine, Red Sea, and Black Sea increasing significantly. (Financial Times)
Crypto Highlights
Chainalysis has filed a lawsuit against the US over a $95M contract awarded to TRM Labs by US Immigration and Customs Enforcement (ICE), with the sealed complaint not disclosing Chainalysis' specific objections or requested remedy.
Trezor and SafePal crypto wallet owners face a high risk of phishing attempts after separate data leaks exposed the information of 54,000 wallet users, with CLARITY odds currently at 10%.
DefiLlama's founder announced that the company has delayed its mobile launch due to the presence of phishing apps on the Apple Store, with one fake app being removed by Apple within days after DefiLlama documented it draining funds from a small crypto wallet.
Ethereum developers are set to narrow down 66 proposals related to the upcoming Hegotá upgrade, which aims to introduce more native privacy for Ethereum applications.
Greenlane's $70M BERA treasury ended Q2 valued at $16M, resulting in a $19.1 million noncash valuation loss, as BERA's price fell nearly 76% year to date, according to the company's records.
US Spot ETF Flows
| Fund | Weekly Net Flow | Cumulative Inflow | AUM |
|---|---|---|---|
| BTC Spot ETF | $-389.7M | +$51,806.8M | $76.61B |
| ETH Spot ETF | $-2.3M | +$11,452.9M | $10.52B |
| SOL Spot ETF | +$10.3M | +$1,157.6M | $0.89B |
Spot ETF Daily Flows — BTC, ETH & SOL
Cost Basis Distribution & Liquidation Exposure
BTC
ANALYST INTERPRETATION — BTC
1. Positioning & Derivatives Read
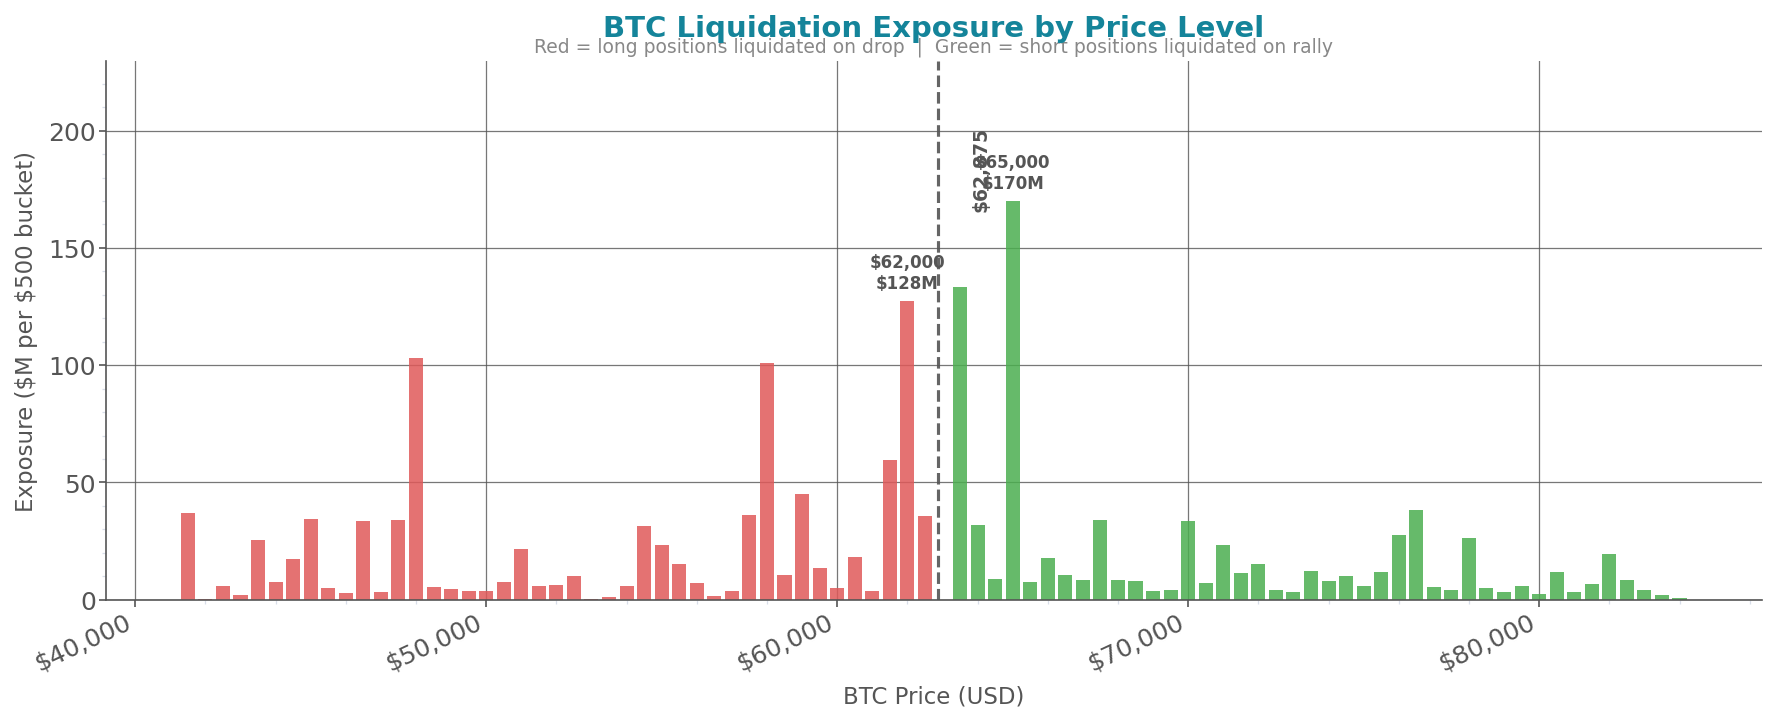
The data indicates that $95M of BTC perp longs were liquidated, while $23M of BTC perp shorts were liquidated, resulting in a long/short ratio of 3.52. This suggests that longs are more exposed going into next week. The ETF flow direction and magnitude show a weekly net flow of $-390M, indicating a decrease in demand for BTC. Given the liquidation exposure clusters, the market is over-extended on the long side, with more size stacked near spot on the long side. The fact that $133.4M of short squeeze levels sit just above the current price at $63,500 indicates that the market is vulnerable to a short squeeze.
2. Key Risks & Levels for Next Week
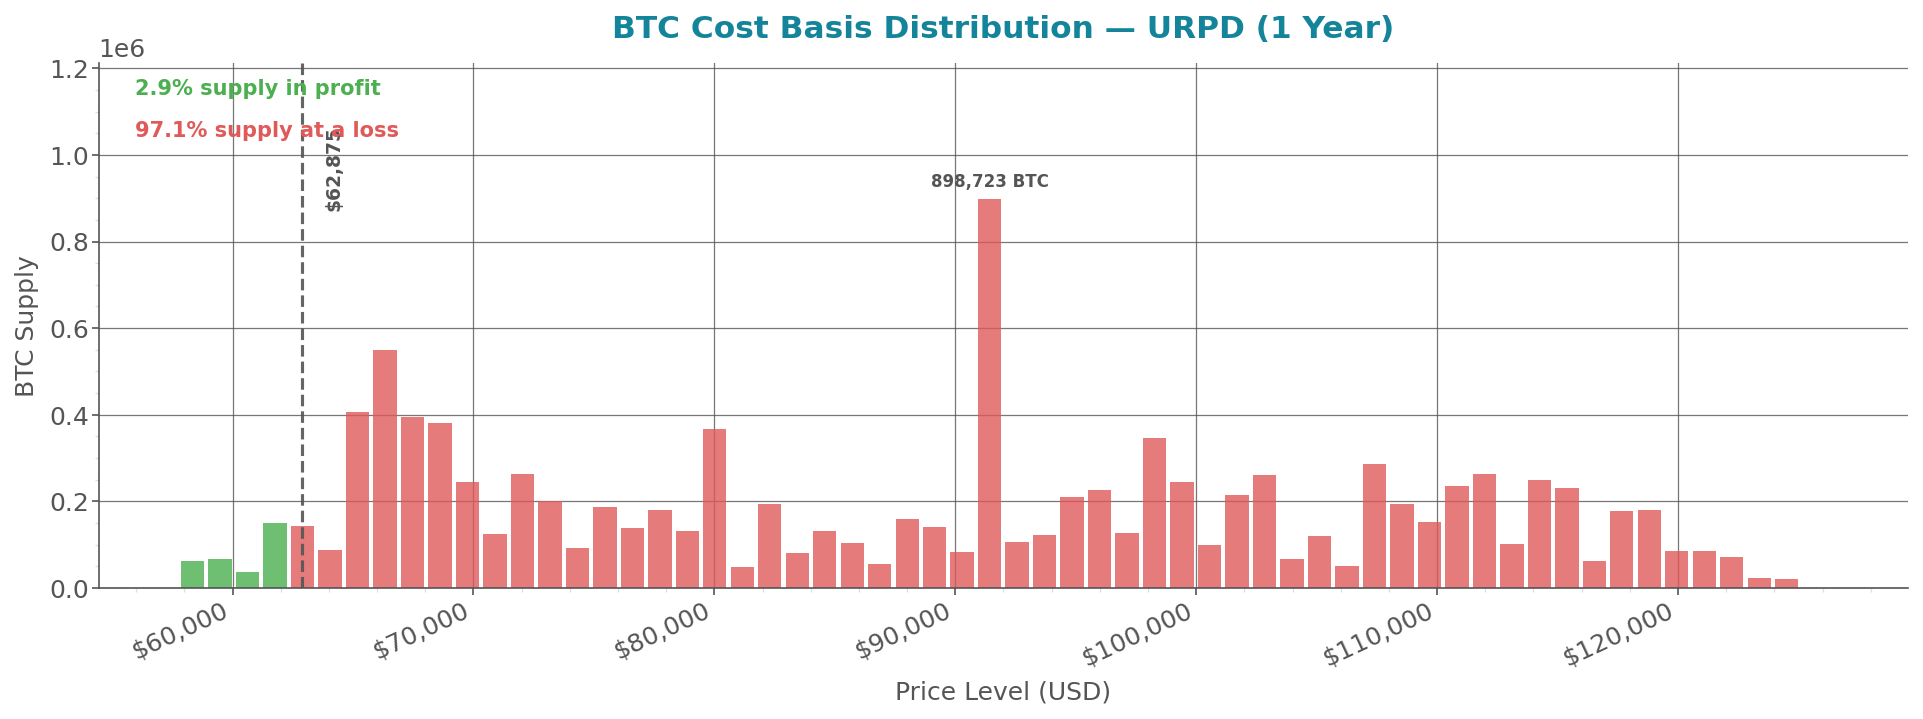
Long Liquidation Risk: The largest cost basis cluster below BTC spot sits at $62,612 with 80930.03 BTC, and a breach of this level would push $127.6M in open longs underwater and into the highest liquidation exposure band in the heatmap. Watch for BTC spot volume accelerating on the way down, not after, as this would be the tell that the risk is playing out.
Short Squeeze Risk: A move above $63,500 would put $133.4M of short positions at risk of liquidation, and an increase in BTC spot buying volume would be the signal that this risk is unfolding. The fact that 277752.64 BTC are held at cost basis at $66,760 indicates that there is significant supply above the current price that could act as resistance.
Support Break Risk: A break of the $61,920 support level, where 107982.46 BTC are held at cost basis, would put $59.6M of long positions at risk of liquidation, and a decrease in BTC spot buying volume would be the indicator that this risk is materializing.
ETH
ANALYST INTERPRETATION — ETH
1. Positioning & Derivatives Read
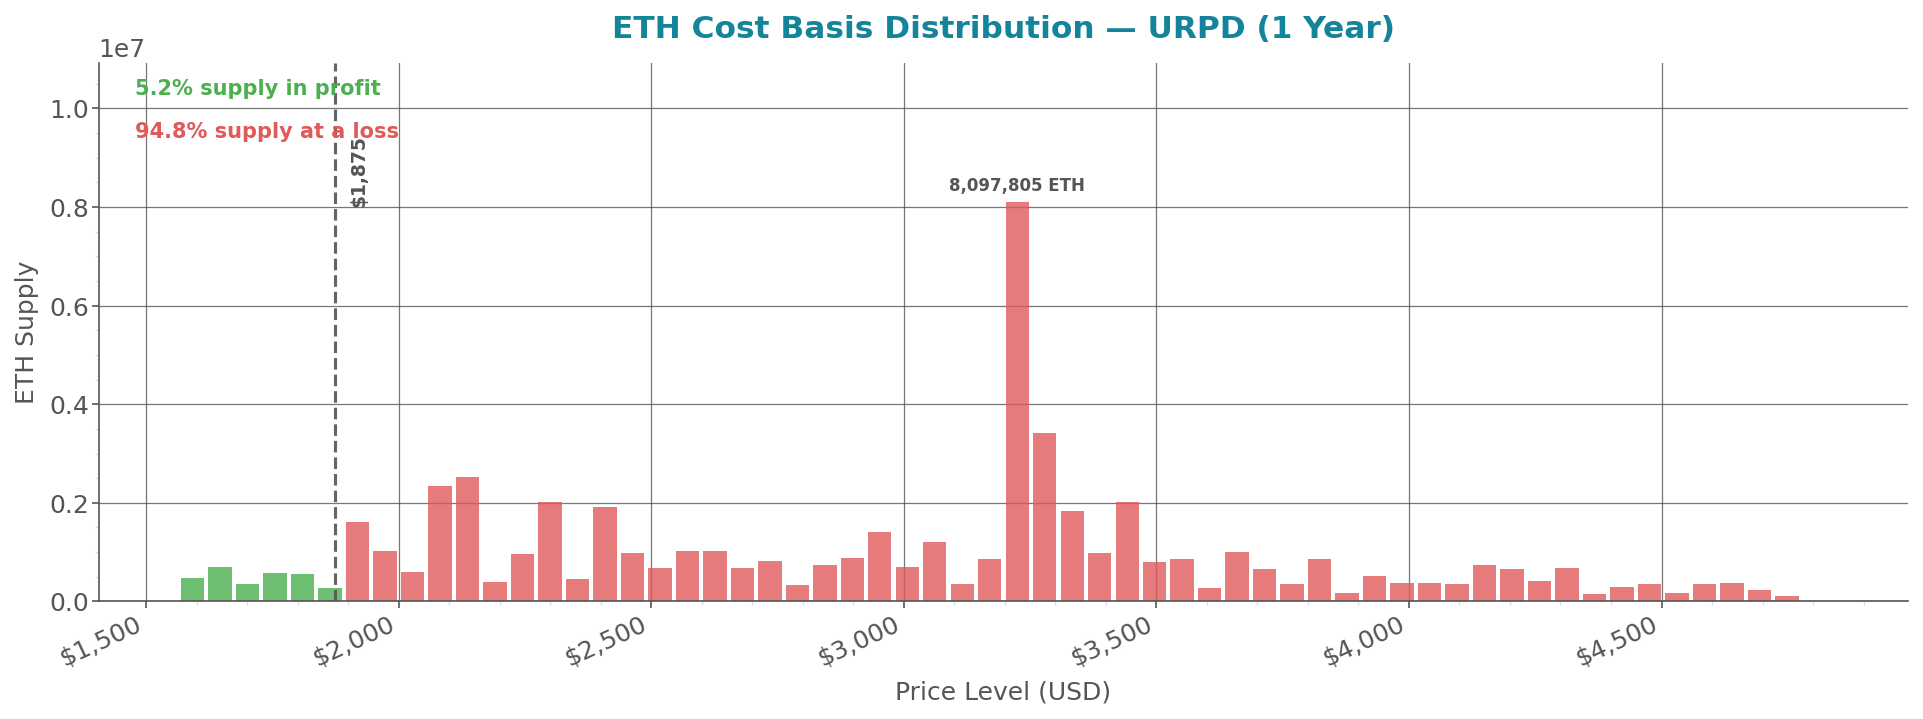
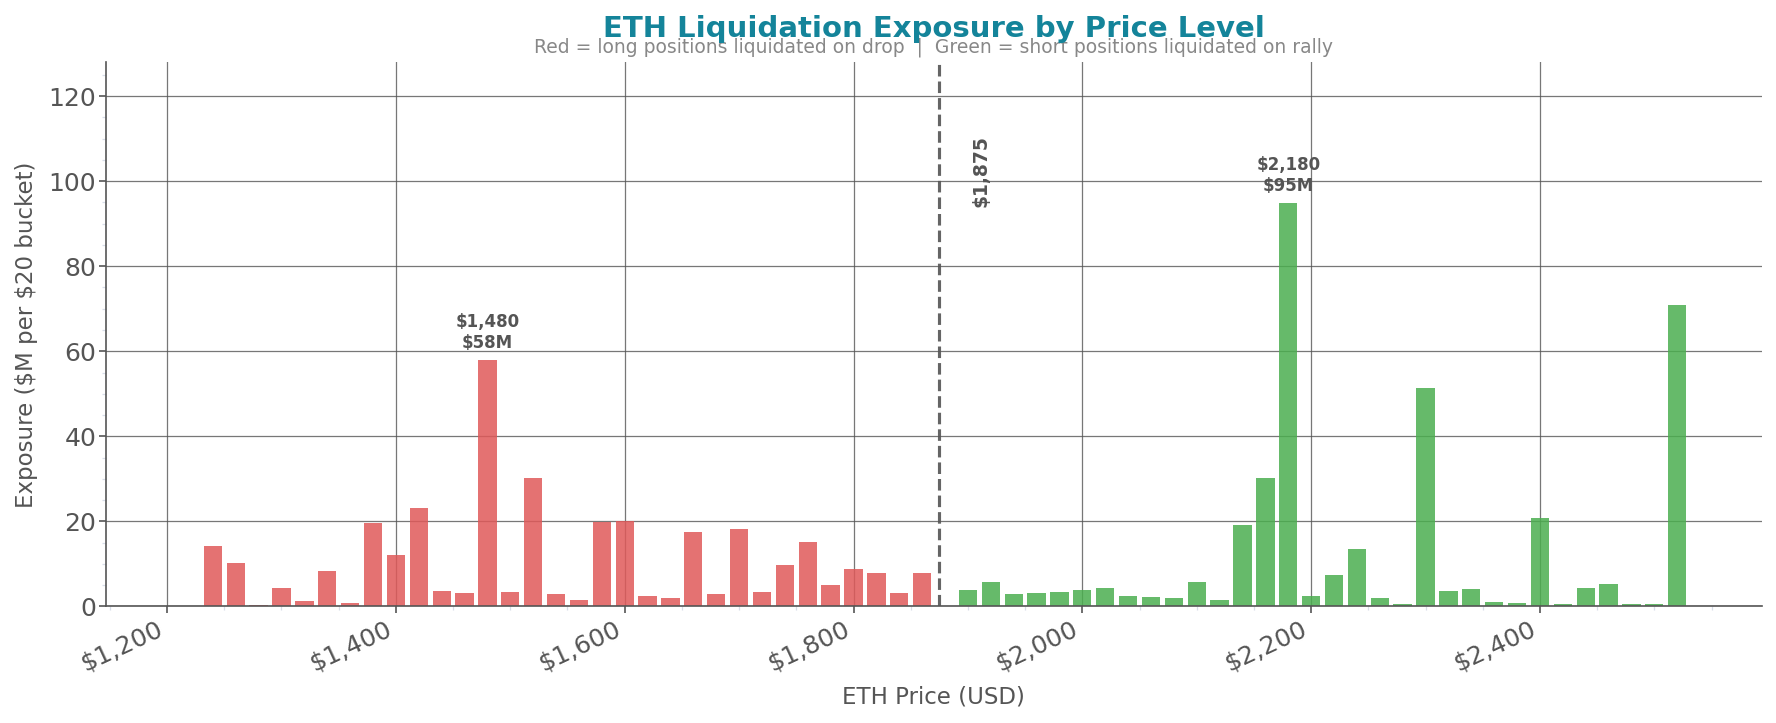
The ETH market saw $2M in weekly net outflows from ETFs, with a cumulative net flow of $11.5B and AUM of $10.5B. The long/short ratio for ETH perpetual futures liquidations ended the week at 3.52, with $95M in longs liquidated and $23M in shorts liquidated. The largest cost basis cluster below ETH spot sits at $1,829, with 286,408.60 ETH, and a breach of this level would push $30.2M in open longs underwater and into the highest liquidation exposure band in the heatmap. Given the current positioning, the market is over-extended on the long side, with more exposure to downside risk.
2. Key Risks & Levels for Next Week
Long Liquidation Risk: The largest cost basis cluster below ETH spot sits at $1,829, with 286,408.60 ETH. A breach of this level would push $30.2M in open longs underwater and into the highest liquidation exposure band in the heatmap. Watch for ETH spot volume accelerating on the way down, not after, as this would indicate increasing selling pressure.
Short Squeeze Risk: The largest short squeeze level above ETH spot sits at $2,160, with $30.3M in potential short squeeze capital. A rapid move towards this level would increase the likelihood of a short squeeze, with ETH spot price momentum and increasing buy volume being key indicators of this risk playing out.
Support Break Risk: The cost basis cluster at $1,664, with 412,700.38 ETH, represents a key support level for ETH. A breach of this level would push a significant amount of open longs underwater, increasing the likelihood of further downside. Watch for increasing ETH spot sell volume and declining buy volume as indicators of this risk materializing.
On-Chain Signals — Bitcoin
| Signal | Week-End | Week Chg | Reading |
|---|---|---|---|
| MVRV Ratio | 1.210 | -1.5% | Fair value zone |
| NUPL | 0.187 | -6.1% | Hope / Fear |
| Perp Funding Rate | +0.00464% | -21.9% | Near-neutral |
| Perp Open Interest | $31.90B | +3.0% | |
| 1M Implied Vol | 32.1% | -3.6% | Low vol environment |
| 25Δ Put/Call Skew | 13.4% | +7.6% | Calls bid — bullish |
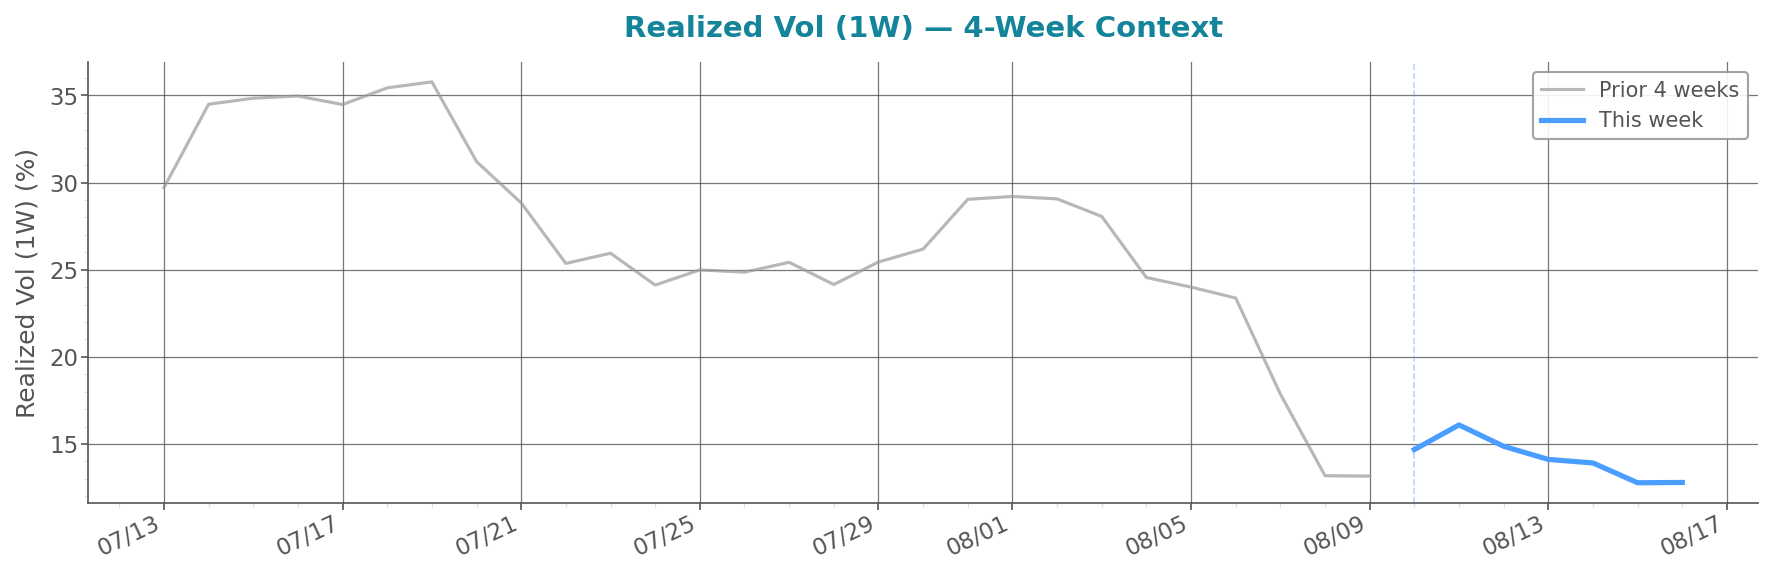
| Realized Vol (1W) | 12.8% | -12.8% | Low realized vol |
| DVOL Index | 35.16 | -3.2% |
Amber rows deviate >1.5σ from prior 4-week baseline • data as of 2026-08-16
Notable — Realized Vol (1W): 2.4σ below 4-week baseline
Notable — Perp Open Interest: 2.4σ above 4-week baseline
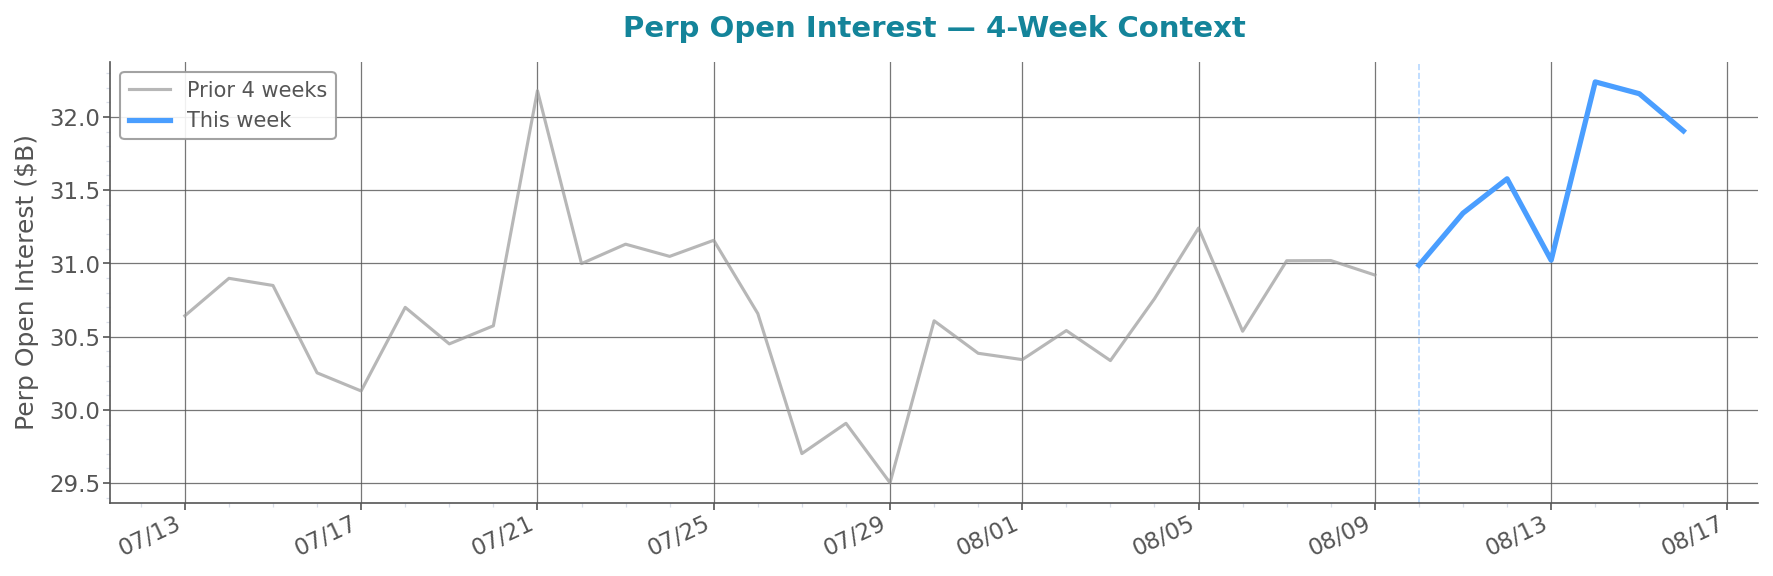
Bitcoin's MVRV Ratio of 1.210 and NUPL of 0.187 suggest the market is in a moderate risk-on phase. Perp Open Interest is 2.4σ above baseline at $31.90B, indicating elevated positioning risk. Realized Volatility is 2.4σ below baseline at 12.8%.
Weekly Market Wrap
The macro and equities landscape was marked by mixed performances, with the S&P 500 and Nasdaq closing the week higher, up 0.42% and 0.47% respectively, while the Dow Jones fell 0.45%. The US inflation report, which showed a modest increase in the consumer price index, was a key driver of market movements, as it influenced expectations for future interest rate hikes. The price of oil rose above $82, as traders assessed the likelihood of a US-Iran deal, and gold advanced to a two-month high above $4,400 an ounce.
In crypto markets, Bitcoin and Ethereum prices declined, with Bitcoin falling 2.48% to $63,530 and Ethereum dropping 1.23% to $1,901. Key events in the crypto space included the delay of DefiLlama's mobile launch due to phishing apps, and the exposure of 54,000 Trezor and SafePal crypto wallet users' information, highlighting the ongoing risks of phishing and data breaches. Additionally, Ethereum developers narrowed down proposals for the Hegotá upgrade, aiming to introduce native privacy for Ethereum applications. Institutional investment in crypto continued to grow, with Morgan Stanley increasing its BlackRock Bitcoin ETF holdings by 23% and JPMorgan more than quadrupling its Ether ETF position in Q2.
Looking ahead to next week, key catalysts include the Commodity Futures Trading Commission's meeting on August 20 to explore crypto regulations, which may provide clarity on the regulatory landscape. Additionally, the release of US inflation data and the potential passage of the CLARITY Act in the Senate will be closely watched.