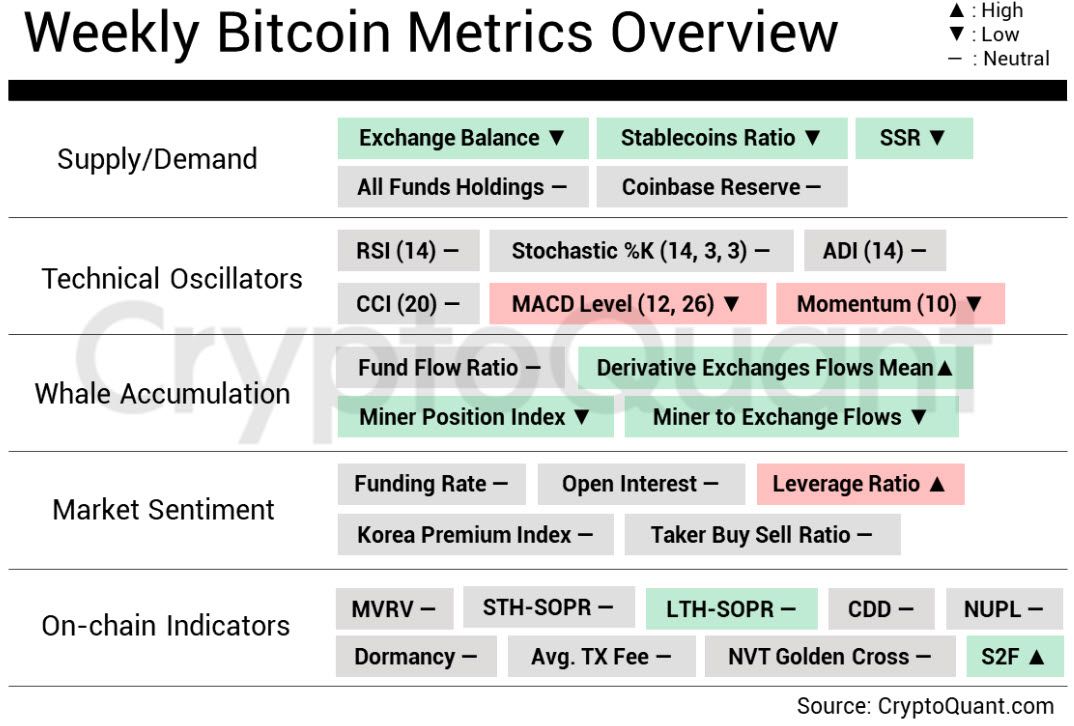
What are On-Chain Metrics ?
On-chain metrics are indicators of a cryptocurrency's fundamentals. They are produced by extracting data from Blockchain ledger which provides public information. These are then aggregated to produce several metrics that describe the behaviour of users and investors.
Below is a list of key On-Chain metrics that are at the core of cryptocurrency fundamental analysis:
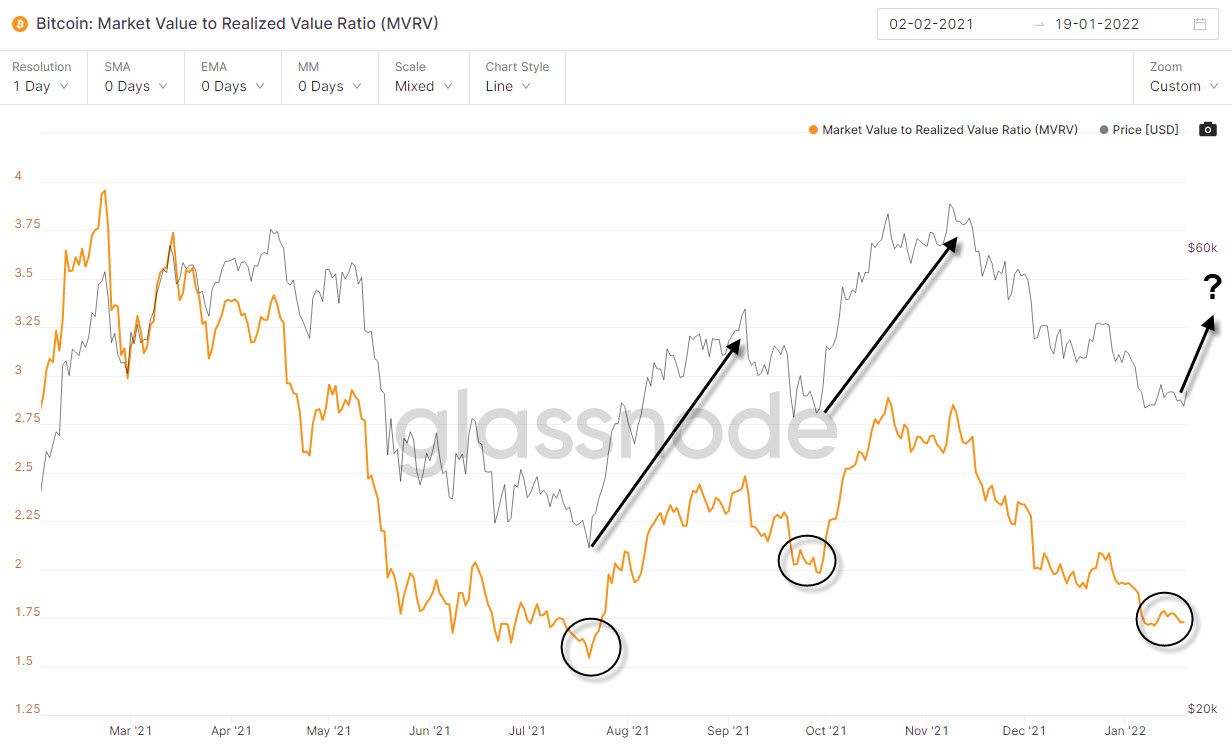
MVRV Ratio (Market Value to Realized Value)
Definition
The MVRV is a ratio of an asset's Market Capitalization versus its Realized Capitalization.
Market Cap: Current value of supply (market value of the asset)
Realized Cap: Cost basis of supply (variation of market capitalization that values each transaction based on the price when it was last moved)
Currently, Bitcoin's MVRV is at 1.72, a level that is relatively low which indicates that the token is undervalued. This level has preceded large spikes in price in 2021, as can be seen on the graph below.
Investment Signals
High MVRV Values
-
Prices have diverged from the cost basis (Realized Cap) by a very large margin, suggesting large unrealized profitability in the market
-
This increases the likelihood of investors selling their coins
-
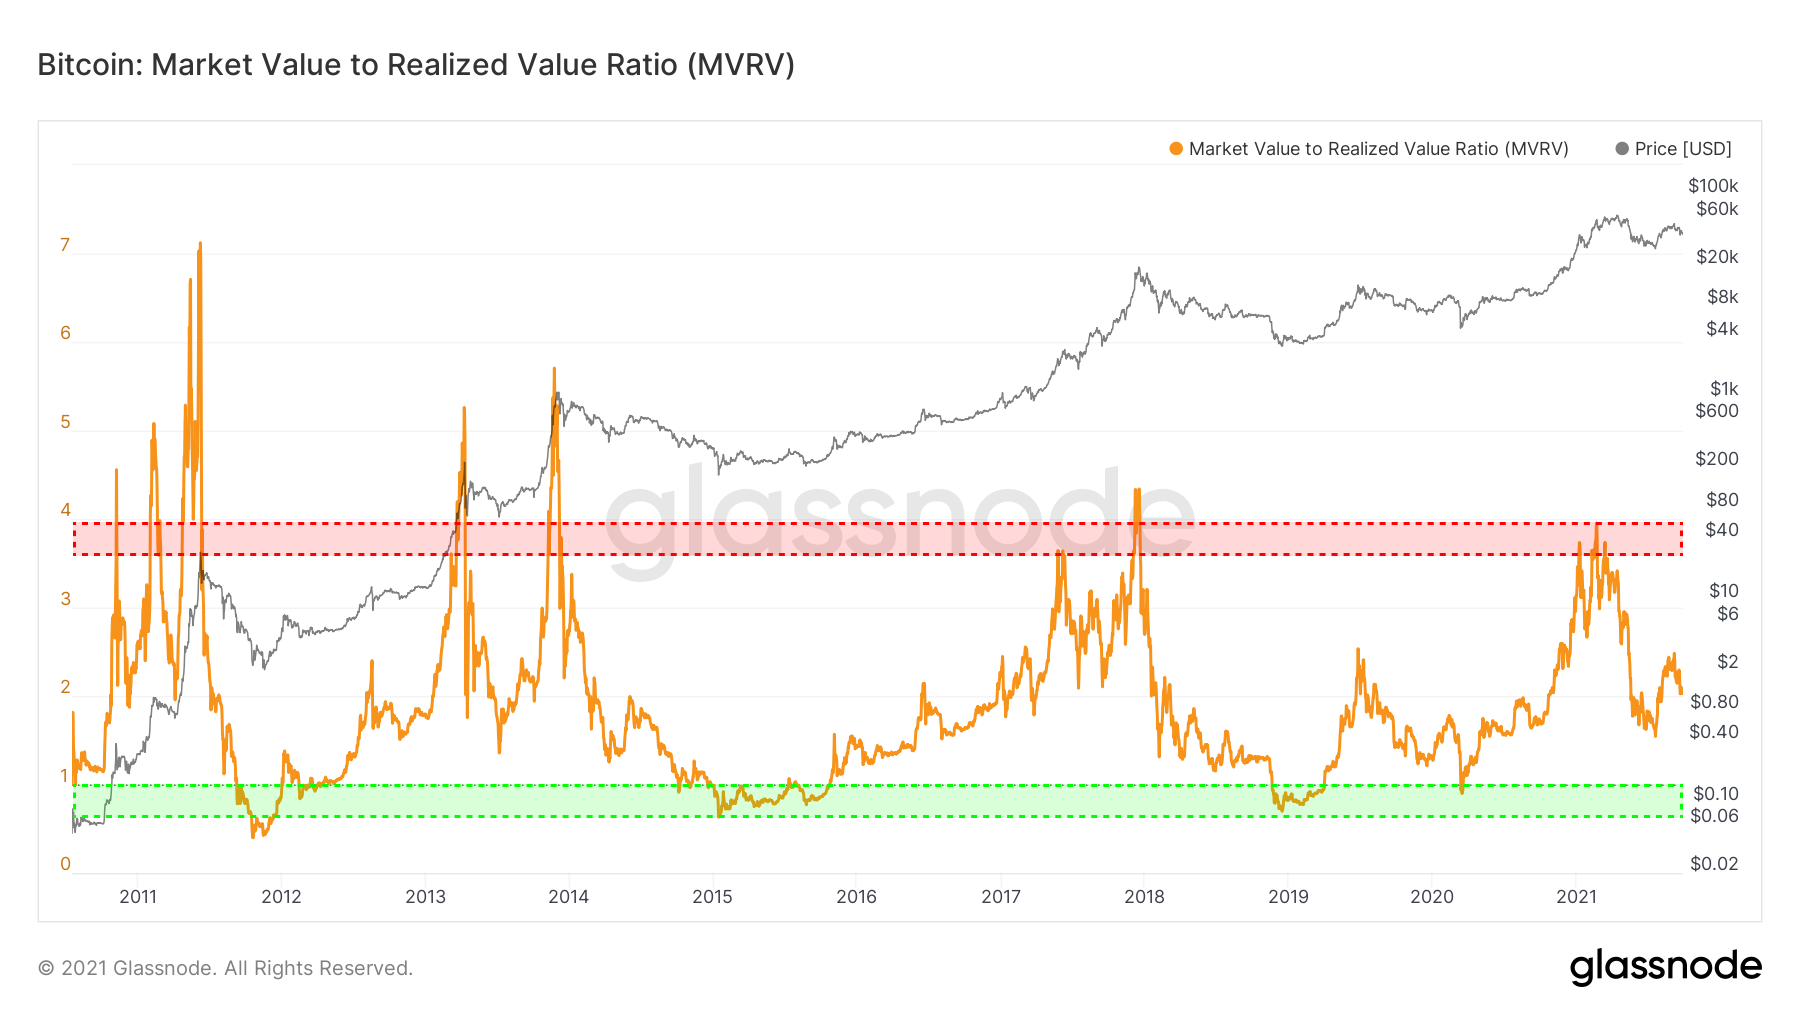
Extreme values (historically > 3.5) are often bearish signals, indicative of potential cycle tops, outlined in red below
Low MVRV Values
-
Prices have fallen below the aggregate cost basis or Realized Cap by a large margin, suggesting that investors' unrealized profits are low or unrealized losses are large
-
Increases the likelihood of investors capitulating and that the asset is undervalued
-
MVRV trading < 1 has historically signalled bear market bottoms, and a good opportunityn to accumulate, as indicated with the green zone below
NUPL (Net Unrealized Profit/Loss)
Definition
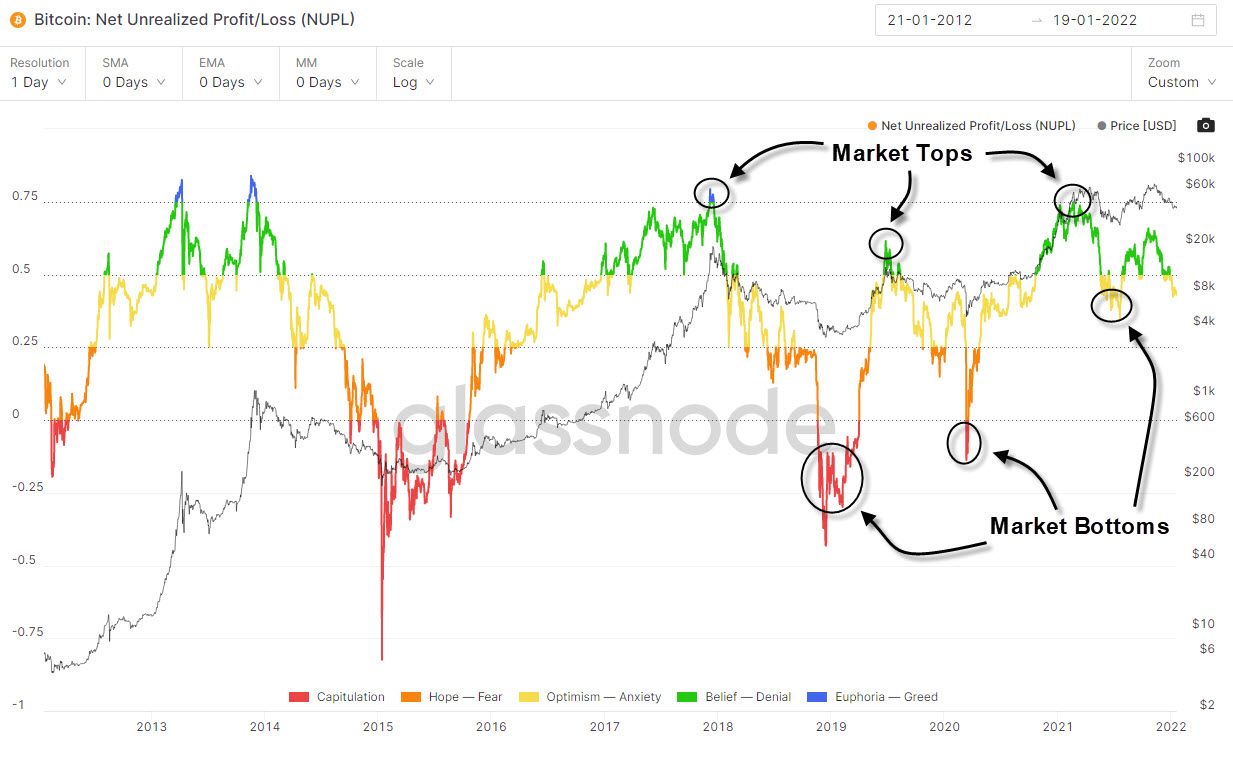
NUPL (Net Unrealized Profit/Loss) looks at the difference between Unrealized Profit and Unrealized Loss to determine whether the network as a whole is currently in a state of profit or loss.
Investment Signals
Any value above zero indicates that the network is in a state of net profit, while values below zero indicate a state of net loss.
In general, the further the NUPL ratio deviates from zero, the closer the market trends towards tops and bottoms.
As such, NUPL can help investors identify when to take profit and when to re-enter.
LTH-SOPR (Long-term Holder Spent Output Profit Ratio)
Definition
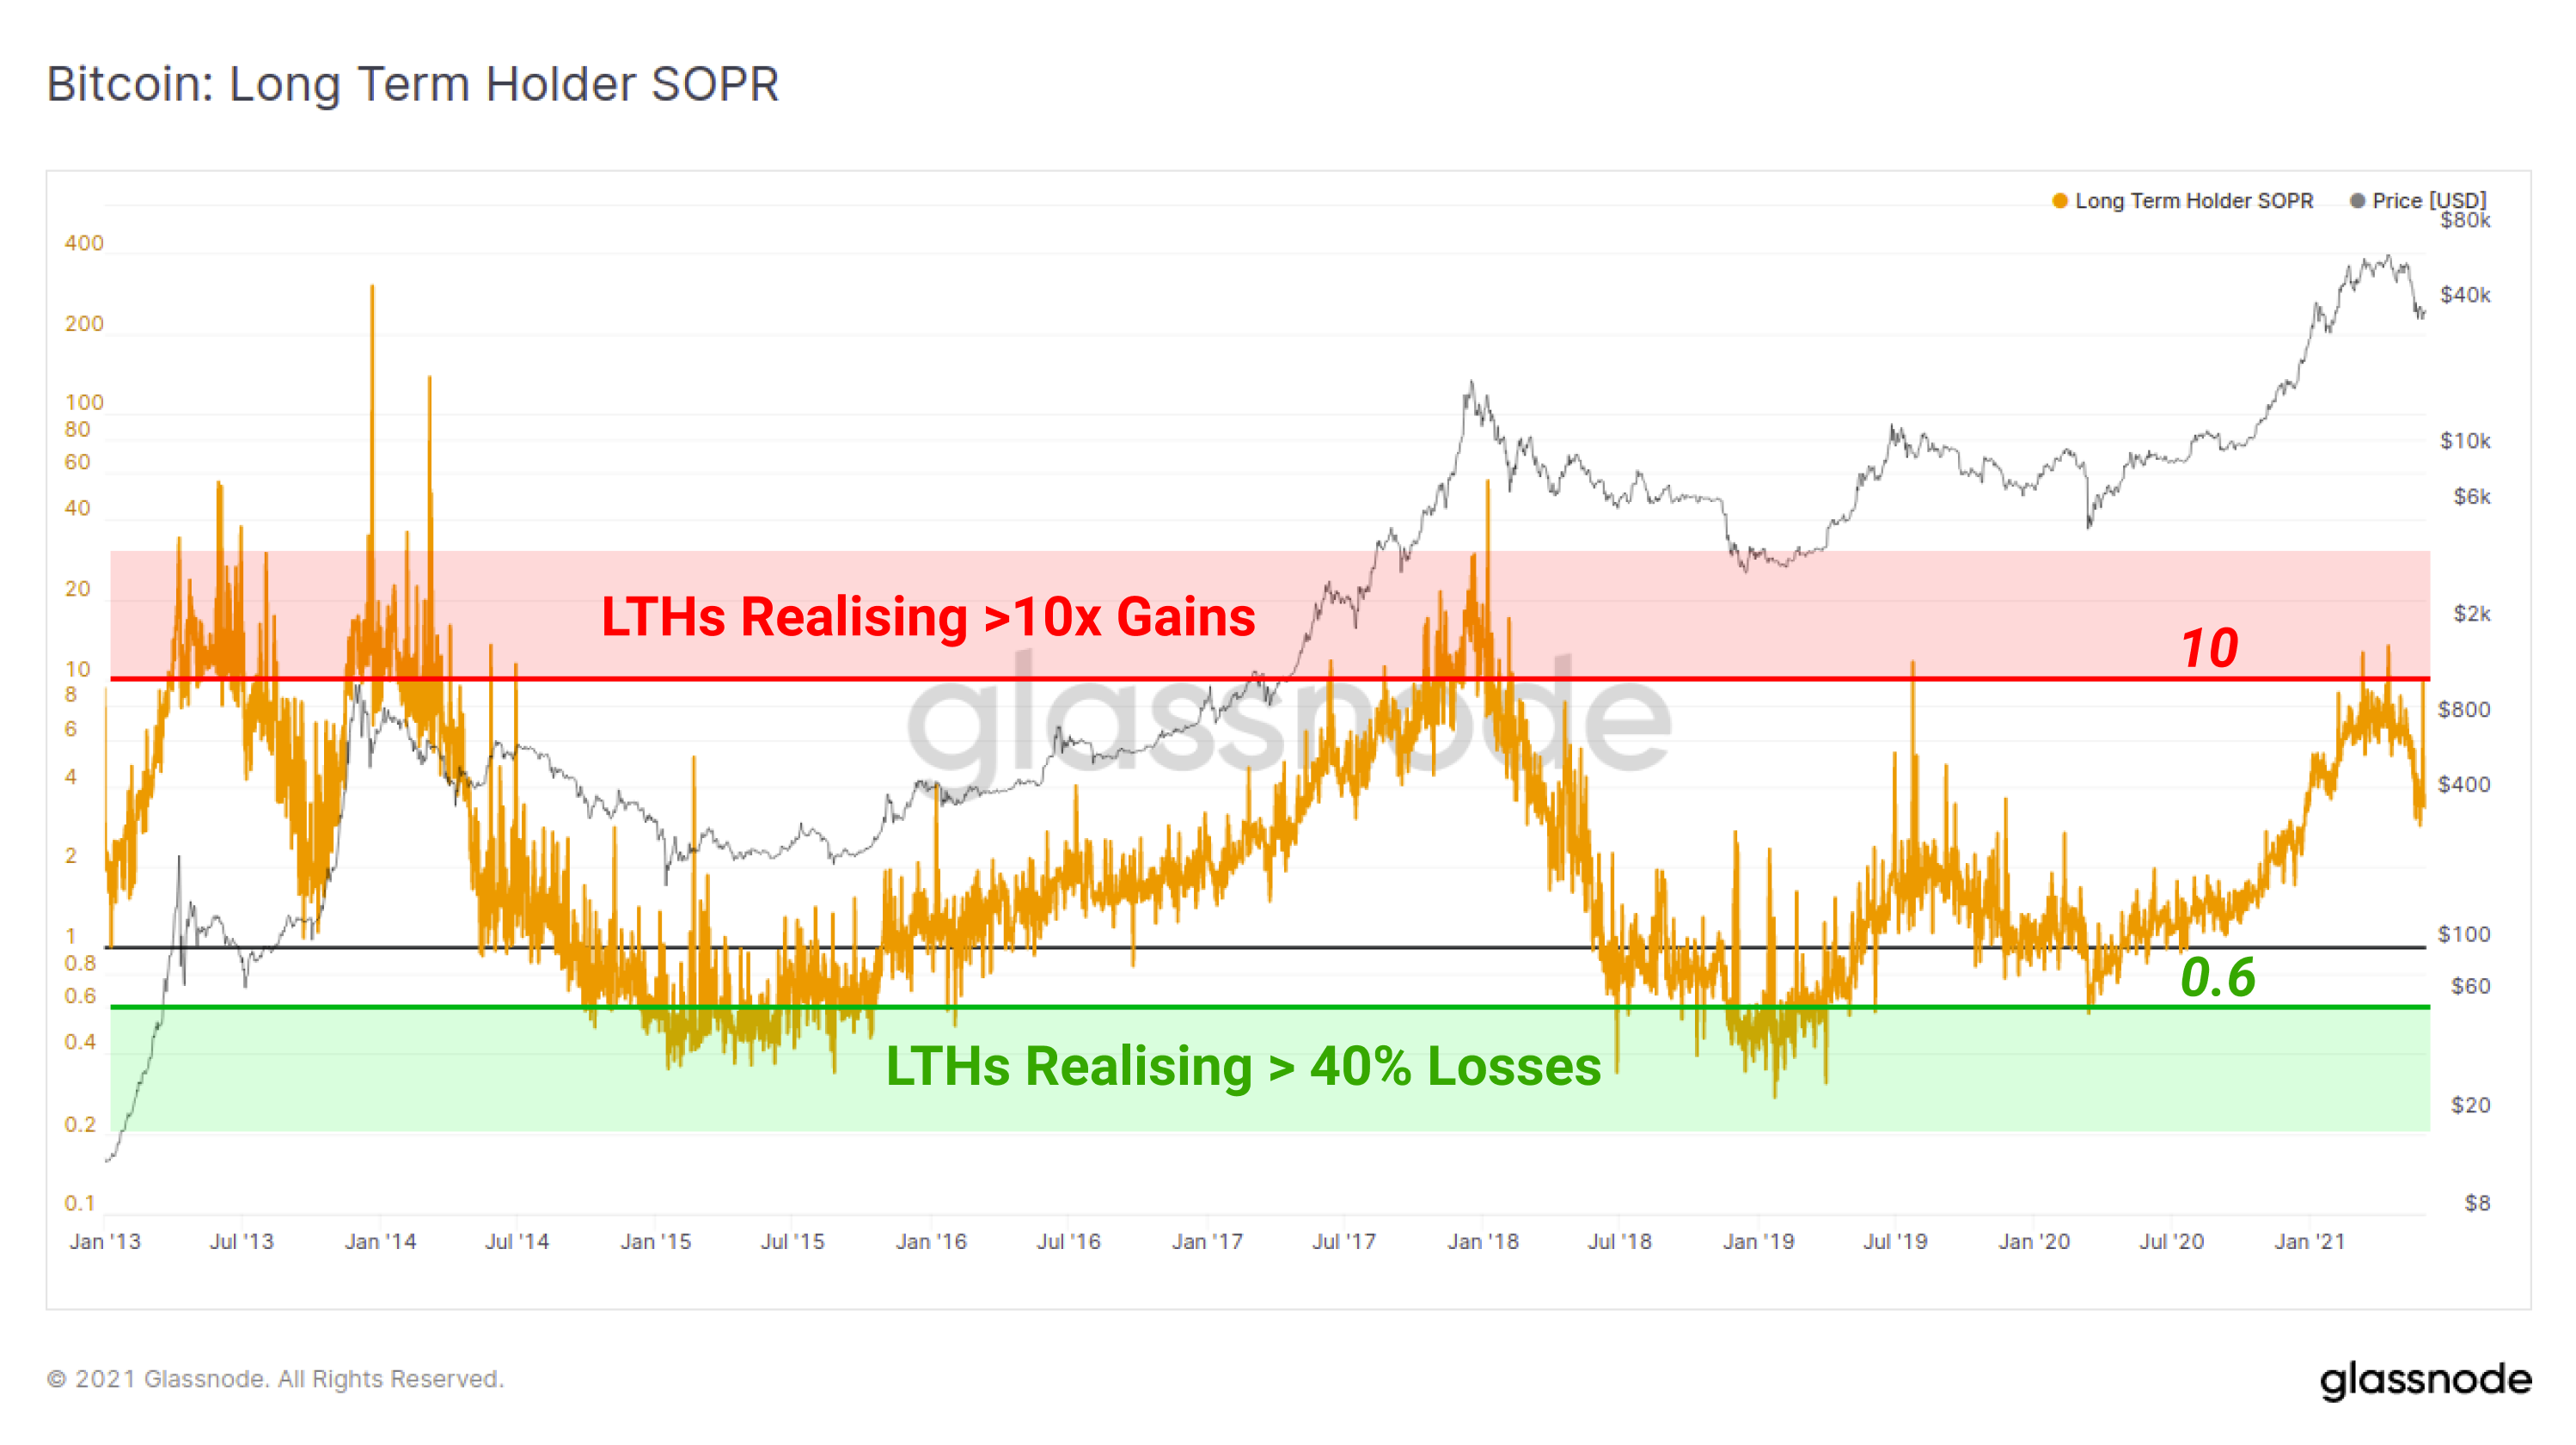
LTH-SOPR is an indicator which reflects the degree of realised profit and loss for all coins moved on-chain that have a lifespan of more than 155-days (long-term holders).
Given Bitcoin's historically exponential price performance in bull markets, and significant draw-downs in bear markets, Long-Term Holders tend to realise relatively large profits or losses when spending their coins.
The spending of 'old coins' may indicate both a change in sentiment and conviction within the smart-money cohort, and also a potential release of illiquid coins back into liquid circulation.
Investment Signals
As price rises or falls significantly from an investors cost price, the incentive to spend increases.
For Long-Term Holders, market extremes can be considered within the following framework:
-
High LTH-SOPR Values indicate that on aggregate, LTHs are realising high profit multiples on spent coins. A LTH-SOPR value of 4.0 can generally be interpreted as LTHs realising an aggregate average profit of 300% (4.0 - 1.0 = 3.0) that day.
-
Low LTH-SOPR Values indicate that on aggregate, LTHs are realising losses on spent coins, which is typical only in bear markets. A LTH-SOPR value of 0.6 can be interpreted as LTHs realising an aggregate loss of 40% (0.6 - 1.0 = -0.4) that day.
LTH-SOPR can provide macro cyclical top and bottom signals as demonstrated in the chart below.
Macro tops have historically been reached when LTH-SOPR values >10 are achieved, indicating profits of 900%+ are being realised by LTHs. Macro bottoms have historically been established where LTHs are realising significant losses with LTH-SOPR reaching 0.6 and below (losses of 40% or more).
Long / Short Liquidation
Definition
Describes the amount of long and short positions liquidated in the derivatives market.
A liquidation is either voluntarily closed or forced to close due to a bankruptcy procedure.
Investment Signal
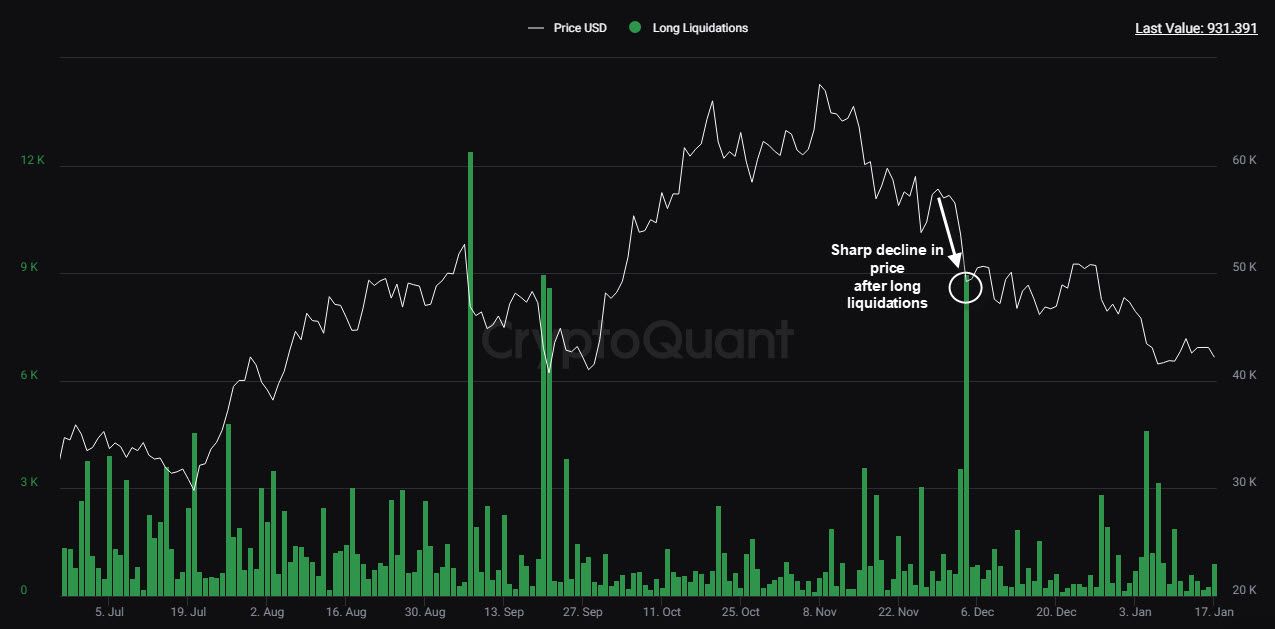
The amount of liquidated long positions can increase suddenly due to an abrupt fall in price which could trigger additional liquidations resulting a long squeeze.
An increasing amount of long liquidations can signal a sharp decline in prices.
Vice versa for short positions if there is a sudden increase in price, creating a potential short squueze.
An increasing amount of short liquidations can signal a sharp increase in prices.
Long Liquidations - Bitcoin
Funding Rate
Definition
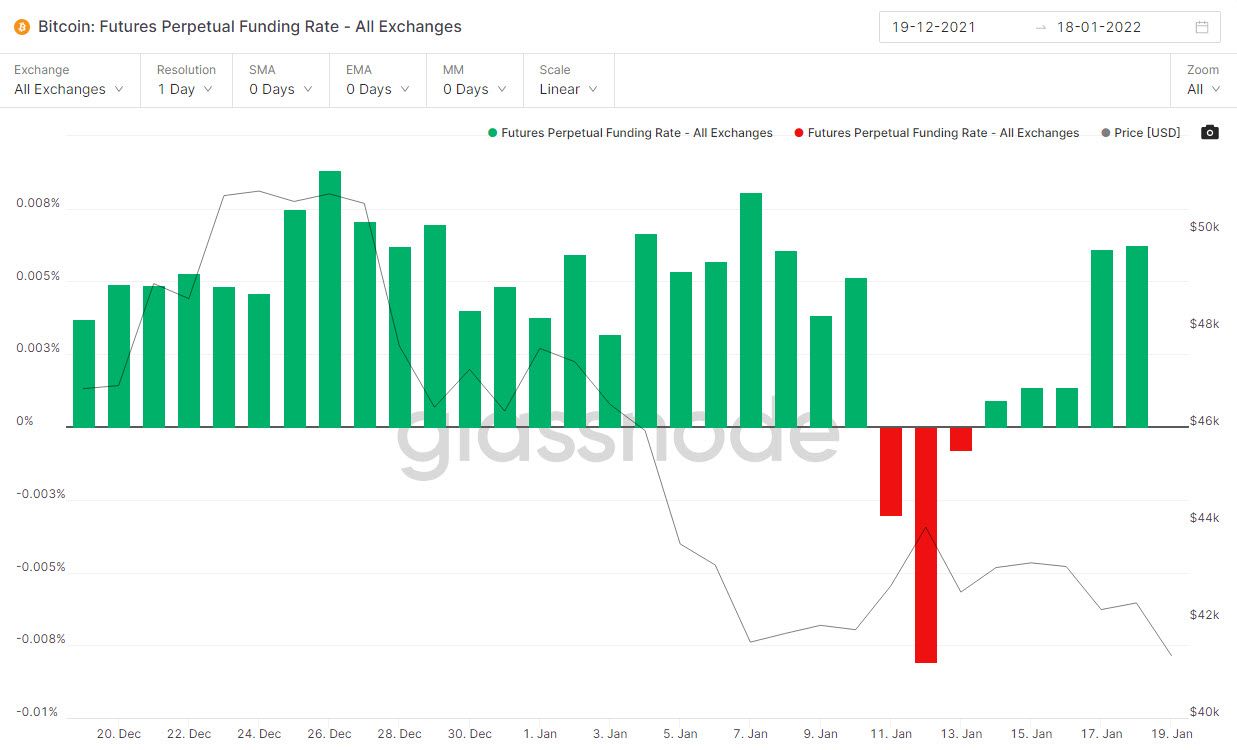
The funding rate is the fee paid by one side of the perpetual futures contract to the other. When the funding rate is positive, it suggests a net bullish bias among derivative traders, since BTC longs are paying BTC shorts and vice versa when the funding rate is negative.
Since there is a higher risk in taking positions against the majority side of the contract, the investors on the majority side pay the other side to maintain the positions.
Investment Signal
If the funding rate is positive ( 0 > ) then the majority of derivatives traders are long and therefore bullish on price, as indicated in green.
If the funding rate is negative ( 0 < ) then the majority of derivatives traders are short and therefore bearish on price., as indicated in red.
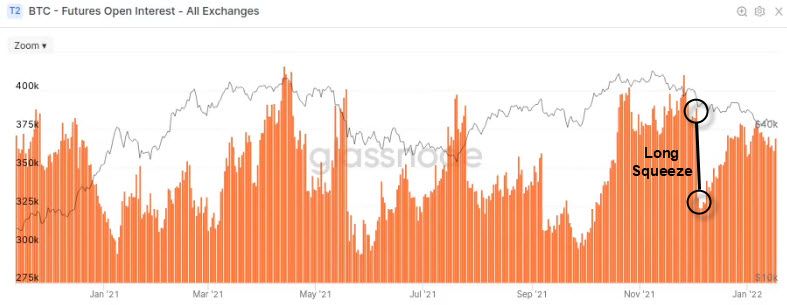
Open Interest
Definition
Open interest is the total amount of derivatives contracts, long or short, open at any given time on all exchanges.
Investment Signal
An increasing amount of open interest can be indicative of excessive leverage being taken on by derivatives traders.
This can signal an increase in market volatility as there can be a risk of a long or short squeeze, depending on the direction of the market.
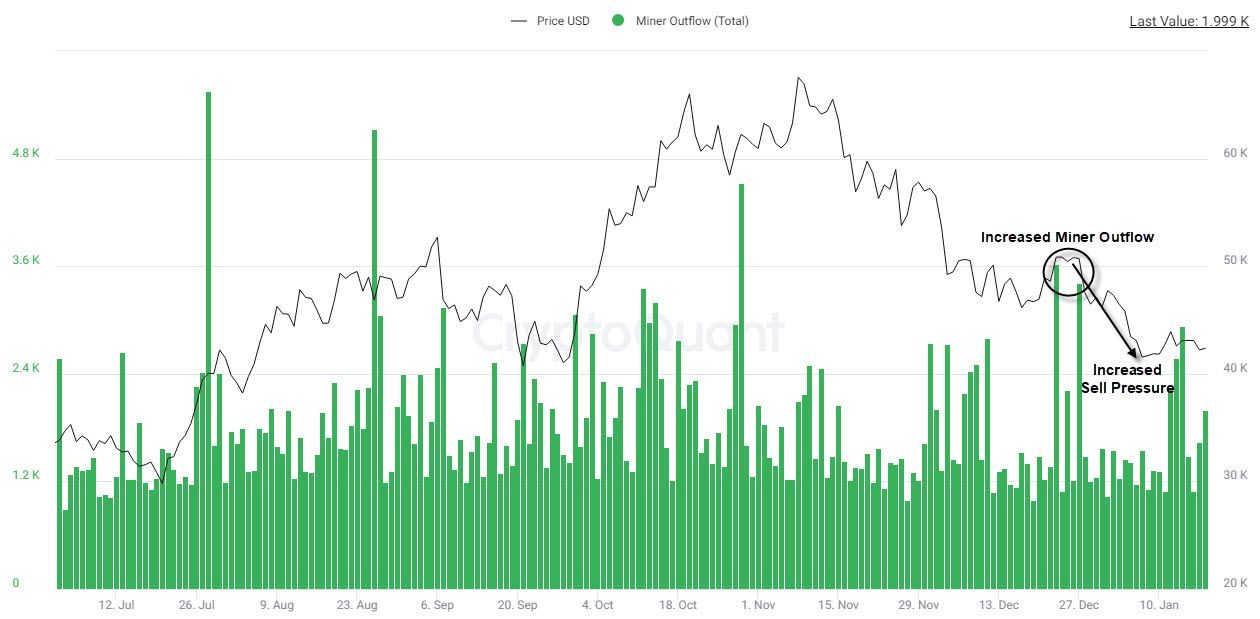
Crypto Miners Outflow
Definition
Describes the amount of newly supplied Tokens to exchanges by miners.
Investment Signal
First off, a mining pool is a joint group of cryptocurrency miners who combine their computational resources over a network to strengthen the probability of acquiring the token reward. The reward is then divded amongst participants of the pool.
This important as large mining pools such as Foundry, play a large role in cryptocurrency markets as they can create large amounts of Tokens and trigger significant price drops. This can occure if they decide to sell a large amount of their mined tokens at once.
A spike in mining outflow can therefore signal the potential for significant sell pressure.
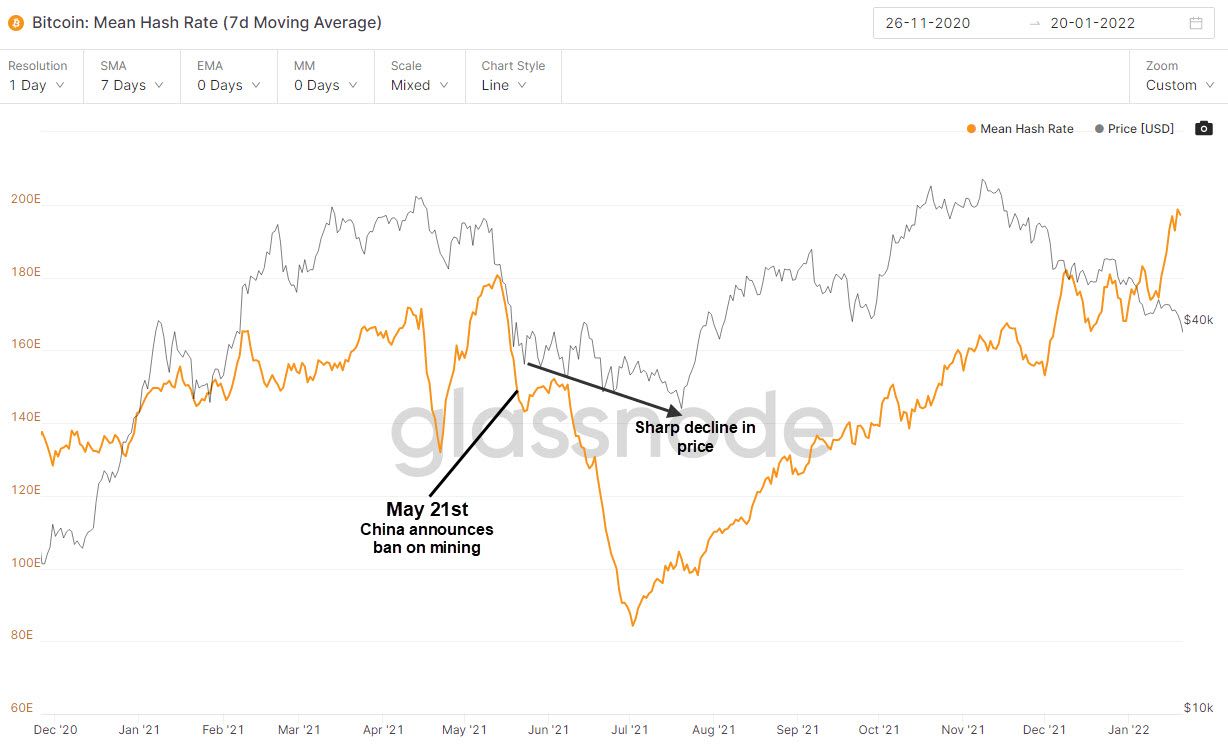
Hash Rate
Definition
The hash rate refers to the total combined computational power that is being used to mine and process transactions on a Proof-of-Work blockchain, such as Bitcoin.
It is an important metric for assessing the strength of a blockchain network - more specifically, its security.
Investment Signal
The higher the hashrate, the larger the number of honest miners dedicated to securing the network and therefore the harder it becomes for malicious agents to disrupt the network.
As such, a higher hash rate for a network is a good signal for the price of the token running on the network. In the past, we have observed the relation between the Bitcoin network's hashrate and the price of Bitcoin. We can observe the drop in the price of Bitcoin in last May, after China announced their ban on cryptocurrency mining. This Ban lead to the decline in global Bitcoin hashrate, as well the decline in Bitcoin's price.
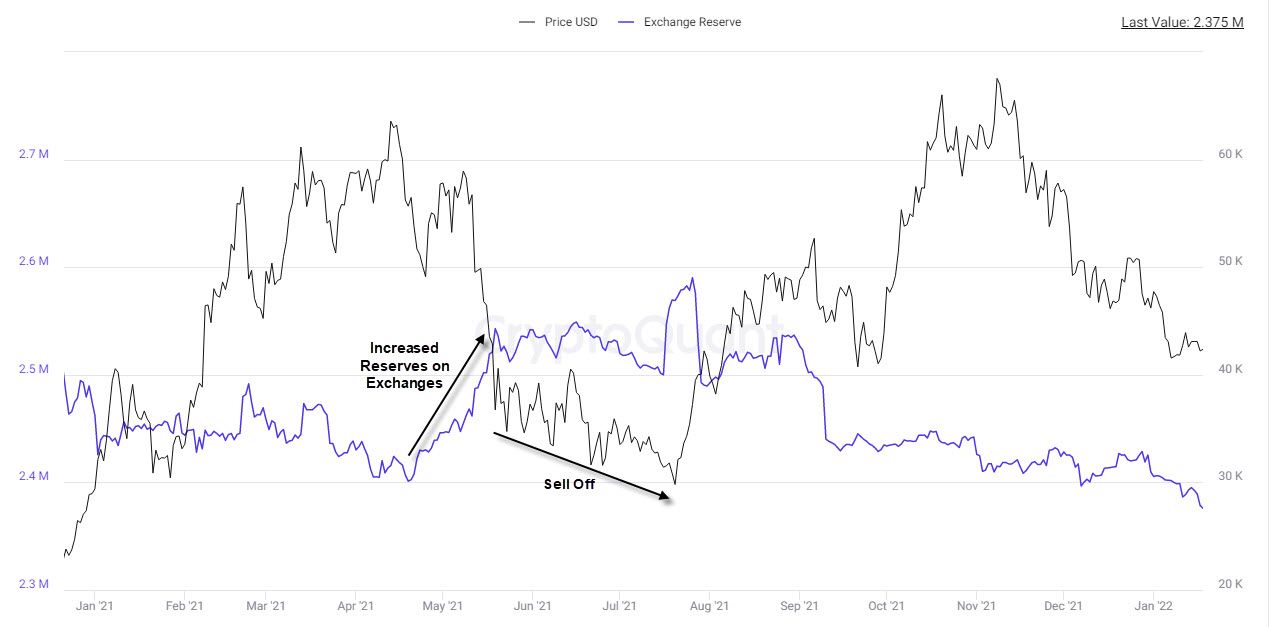
Crypto Exchanges Reserve
Definition
The total number of coins held in all exchanges' wallets.
Investment Signal
The higher the value of the reserve, the higher the chance of selling pressure. The same goes for the other direction as there is lower chance of selling pressure if the value of the reserve is low.
This is because coins that are stored off-exchange, are likely to be stored in cold wallets and therefore not be sold. That is why a decline in the exchanges reserve is positive for prices.
Conversely, coins that are moved onto exchanges are likely to be sold. That is why an increase in the metric is a bearish sign for prices.
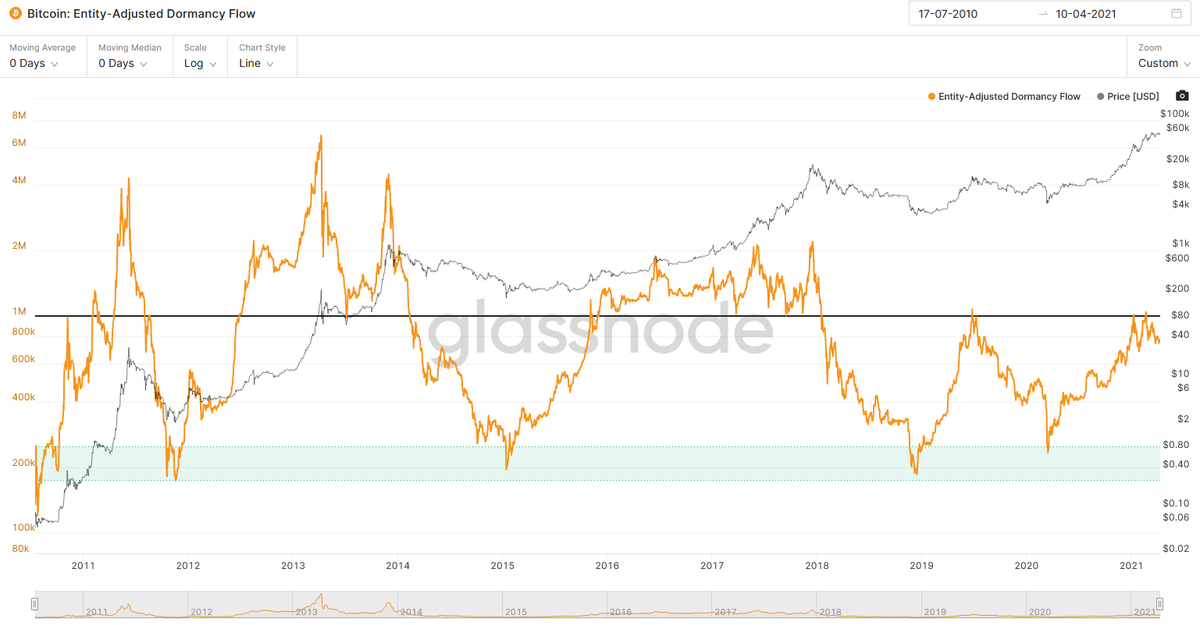
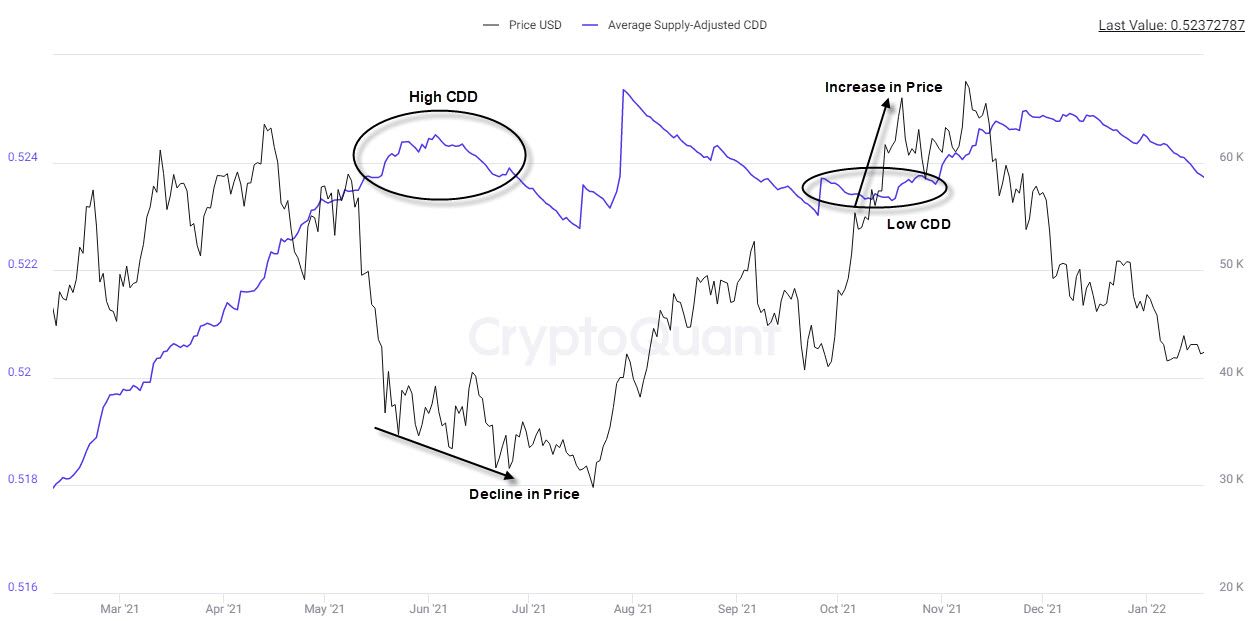
Supply Adjusted CDD (Coin Days Destroyed)
Definition
CDD refers to the sum of all days destroyed by all coins transacted on a given day. This is calculated by taking the number of coins transacted on any given day and multiplying it by the number of days it has been since those coins were last spent.
This metric assesses the average age of coins destroyed, and therefore the type of investors driving activity during a given period.
Investment Signal
When the value of the metric is high, there is a risk of high volatility and a decrease in price as long-term holders are likely selling their positions off.
When the value of the metric is low, the selling pressure in the market is likely low as long-term holders are accumulating and holding onto their coins.
Recap
On-Chain metrics provide a granular approach to the analysis of cryptocurrencies. Unlike any other asset class, all the data produced by cryptocurrency transactions are publically available. This data is then processed in a multitude of ways, which has given way to the new field of On-Chain Analytics.
We have overviewed some of the core metrics that have been developed through On-Chain analytics recently. All these metrics aim to provide investment signals, however can be categorized in the following way:
Macro Value Indicator
- MVRV
- NUPL
Short-Term Indicator - Derivatives Market Analysis
- Long / Short Liquidations
- Funding Rate
- Open Interest
Mining Related Indicator
- Hash Rate
- Net Miner Outflow
Investor Behaviour / Sentiment Indicator
- All-Exchange Reserve
- Supply-Adjusted CDD
Implementing an Investment Framework
These metrics can be combined to produce insightful investment signals. Furthermore, On-Chain analytics can complement other analytical fields such as Technical Analysis, Quantitative Analysis and News / Social Media analysis to provide a complete investment framework for cryptocurrencies.