- BTC continues to trade within a tight range
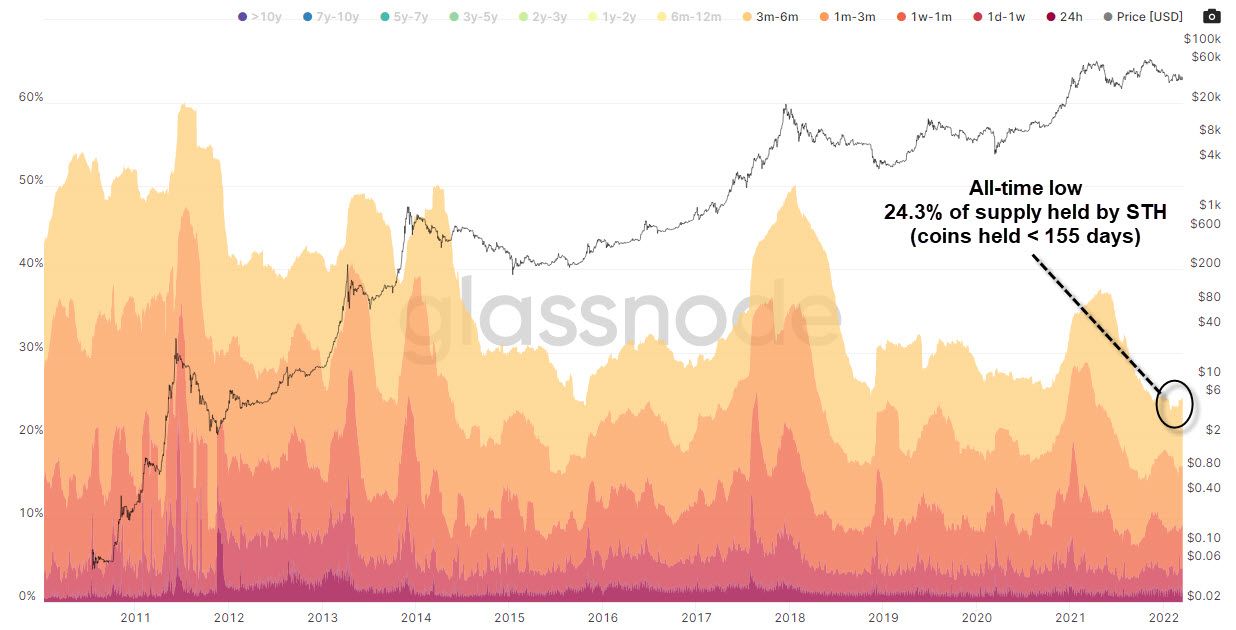
- Short-term holder supply reaches an all-time low
- Coinbase exchange's BTC supply reaches a multi-year low
- Illiquid Supply Shock is approaching Supply Shock levels
- BTC's Implied Volatility is significantly lower than other macro asset classes since the beginning of the war in Ukraine
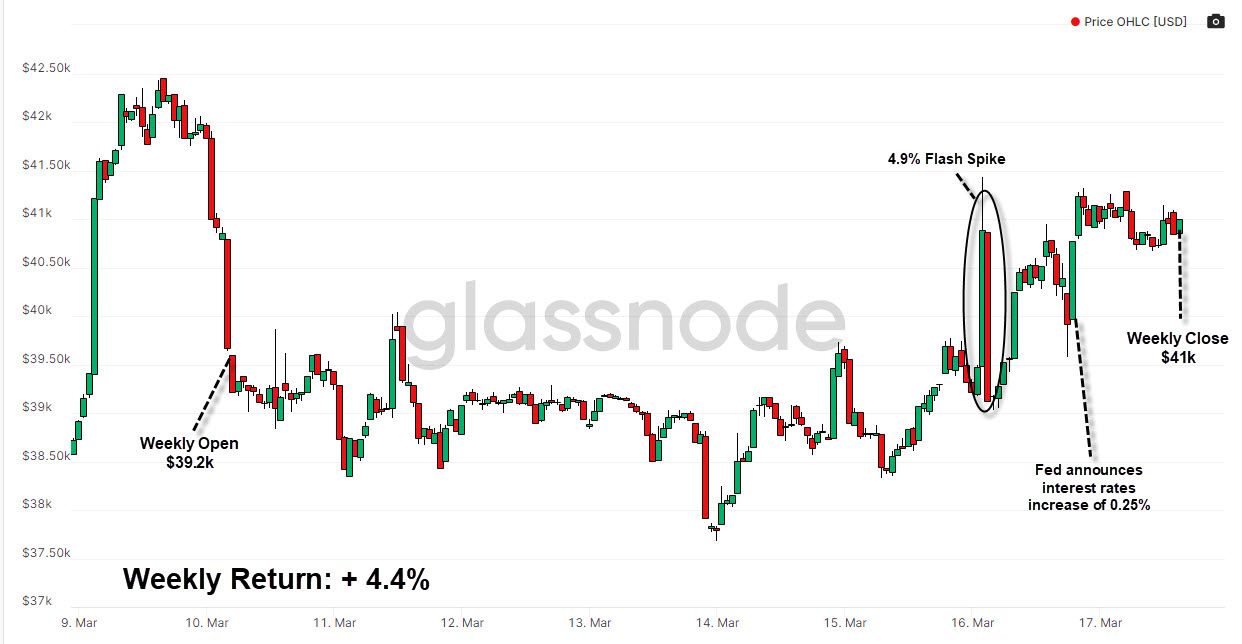
Weekly Price Action
- Bitcoin continued to consolidate this week, compressing in an increasingly tight range between the $37.6k low and the $41.4k high
- The week opened at $39.2k and closed at $41k for a weekly gain of 4.4%
Diminishing Short-Term Holder Supply
- A short-term holder (STH) is an investor that holds Bitcoin for less than 155 days
- Conversely, an investor holding Bitcoin for more than 155 days is considered a long-term holder
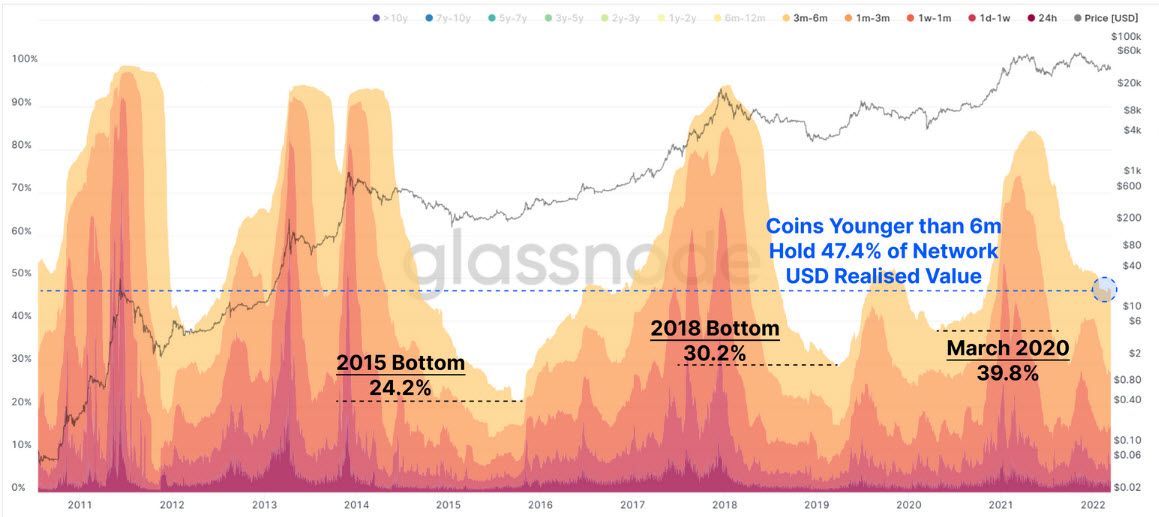
BTC Hodl Waves
- This metric visualizes the proportion of supply held by different cohorts of investors
- We can view the following cohorts for coin age; 24hrs, 1d-1w, 1w-1m, 1m-3m and 3m-6m to view STH supply
- Coins 6-months or younger are at an all-time high
- This cohort represents 24.3% of total supply
- This means that 75.7% of all BTC supply has not moved since October 2021 (6 months)
- This is a constructive observation for price as it suggests the widespread accumulation of Bitcoin by its investor base
BTC Realised Cap Hodl Waves
- This metric is the same as above however instead of representing the proportion of supply of Bitcoin held by various cohorts of investors, it shows the proportion of USD value or the realised capitalisation of Bitcoin's supply held by these various cohorts of investors
- The total proportion / supply of coins held by young coins (> 6 months) is 24.3% whereas the realised cap / USD value held by these coins is 47.4%
- A lot of capital was invested into this cohort of coins as they were bought around October-November when prices reached all-time highs
- The value held by this cohort of coins is historically low and characteristic of late stage bear markets as coins mature into longer-term investor wallets / coins held for + 6 months
Long-Term Institutional Demand
We'll view data from Coinbase as it is:
- The largest exchange by BTC balance
- The preferred venue for US based institutions
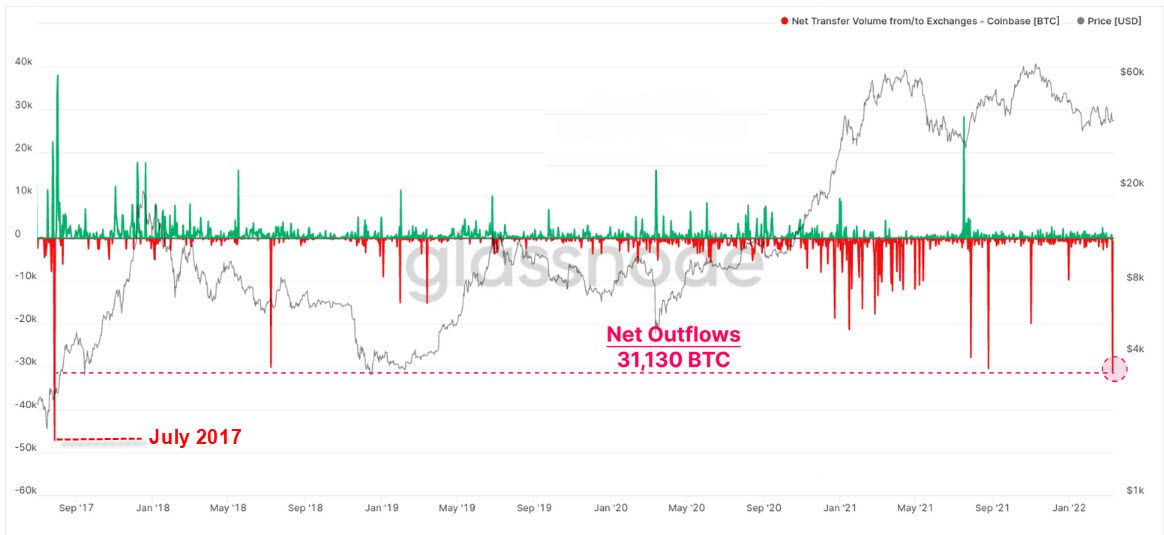
BTC Net Transfer Volume from / to Coinbase Exchange
- Coinbase saw its largest net outflows this week since July 2017
- A regime of outflows is also apparent since 2020, confirming the accumulation that has taken place and indicating that investors view BTC as a relevant asset in modern portfolios
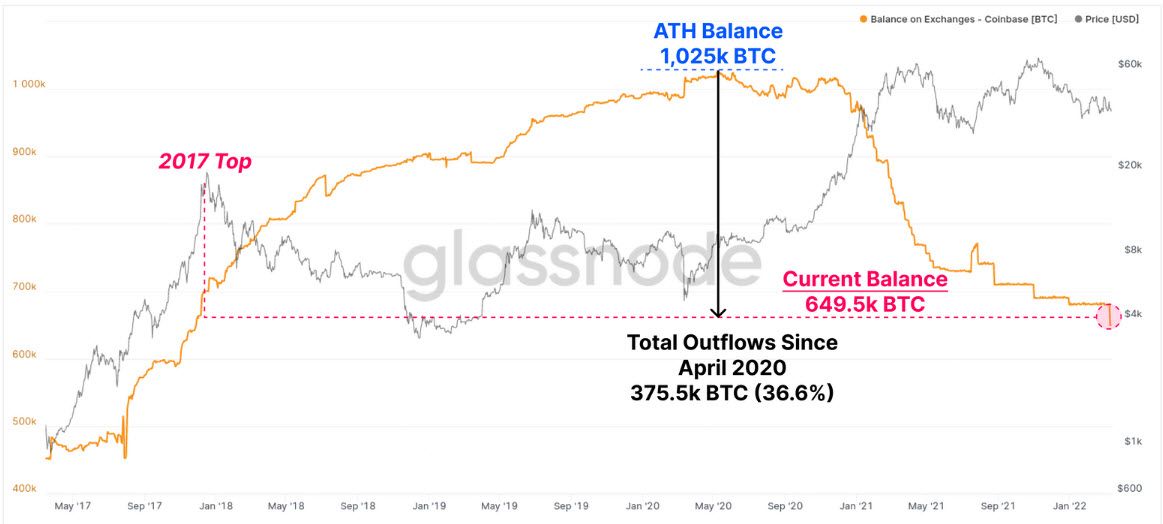
BTC Balance on Coinbase Exchange
- Balance is currently at its lowest level since the 2017 bull market top
- These outflows have been part of a consistent downtrend in the Coinbase balance since March 2020
- This points to the adoption of Bitcoin as a macro asset by larger institutions
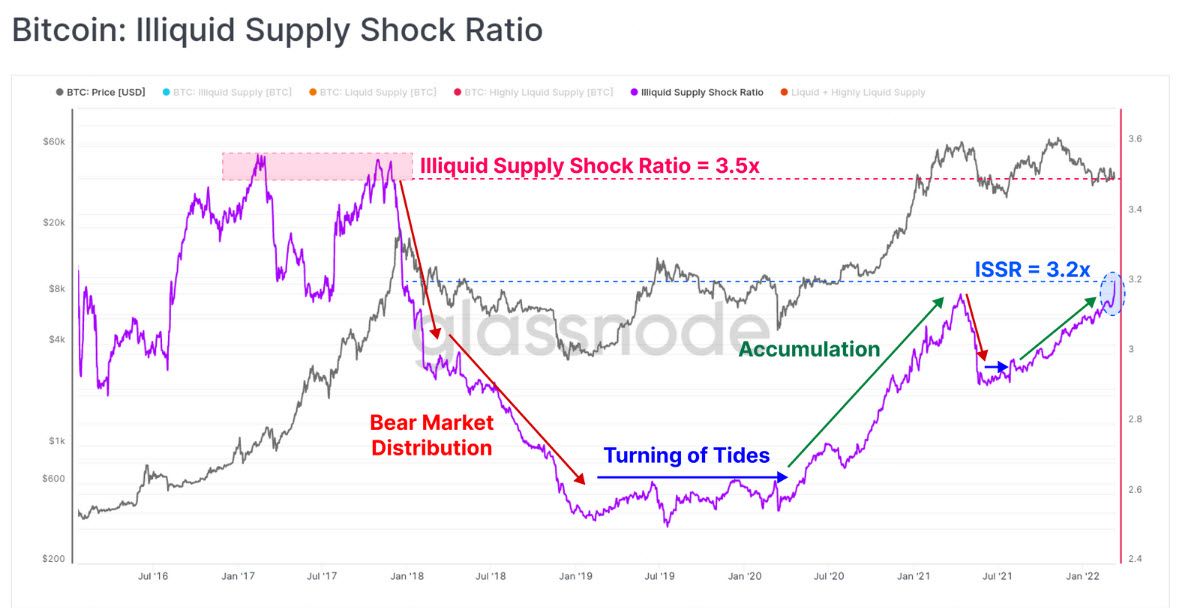
BTC Illiquid Supply Shock Ratio
- Illiquid Supply consists of all coins held in wallets that have little-to-no history of spending
- Liquid & Highly Liquid supply are wallets that have a history of spending
- We saw a significant uptick this week in the metric which indicates that these withdrawn coins have been moved into illiquid wallets
- We currently have a similar market structure to the 2018-20 bear market
- The metric is at 3.2 meaning that there is x 3.2 the illiquid supply than liquid & highy liquid supply combined
- This metric currently indicates that there is still persistent demand despite struggling prices
Summary
A large portion of STH supply is currently held at a loss. This creates the risk of a capitulation event as sellers have not been fully exhausted yet. Such an event would be consistent with previous bear cycles.
Having said that, the widespread accumulation of Bitcoin has continued to dominate investor behaviour. The long-term accumulation trends are still very constructive for long-term price action.
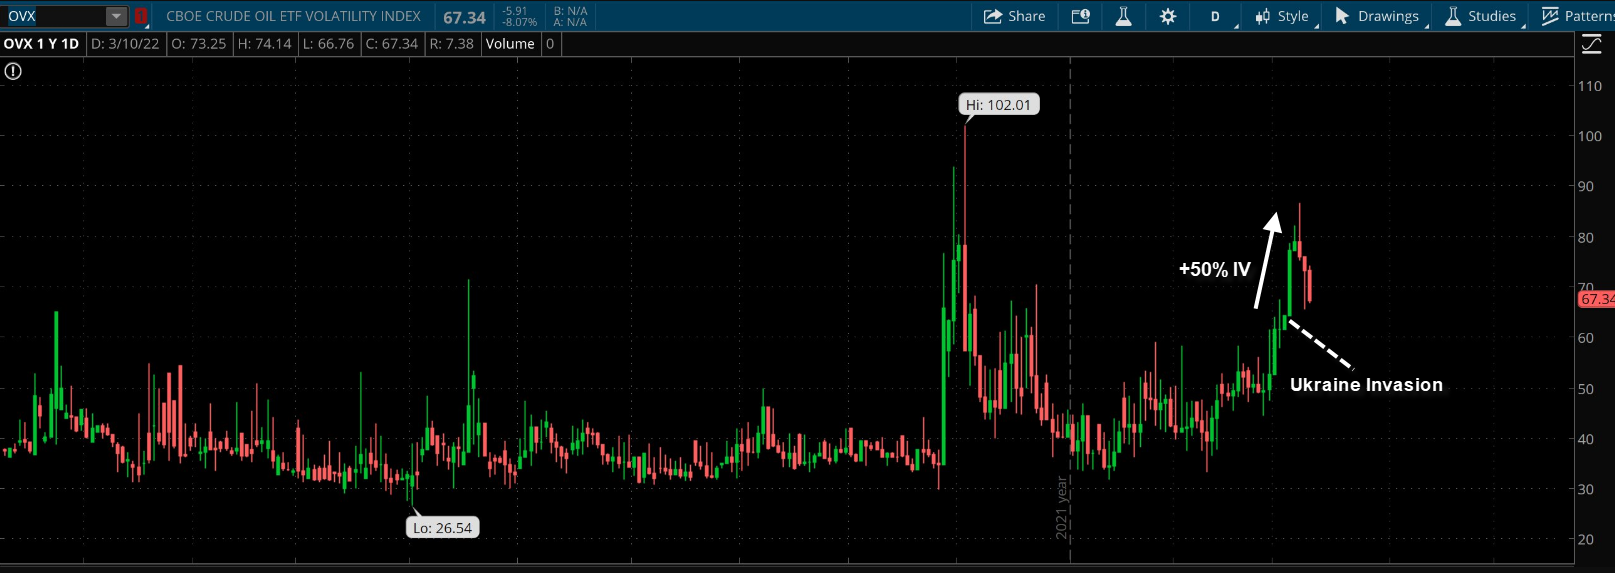
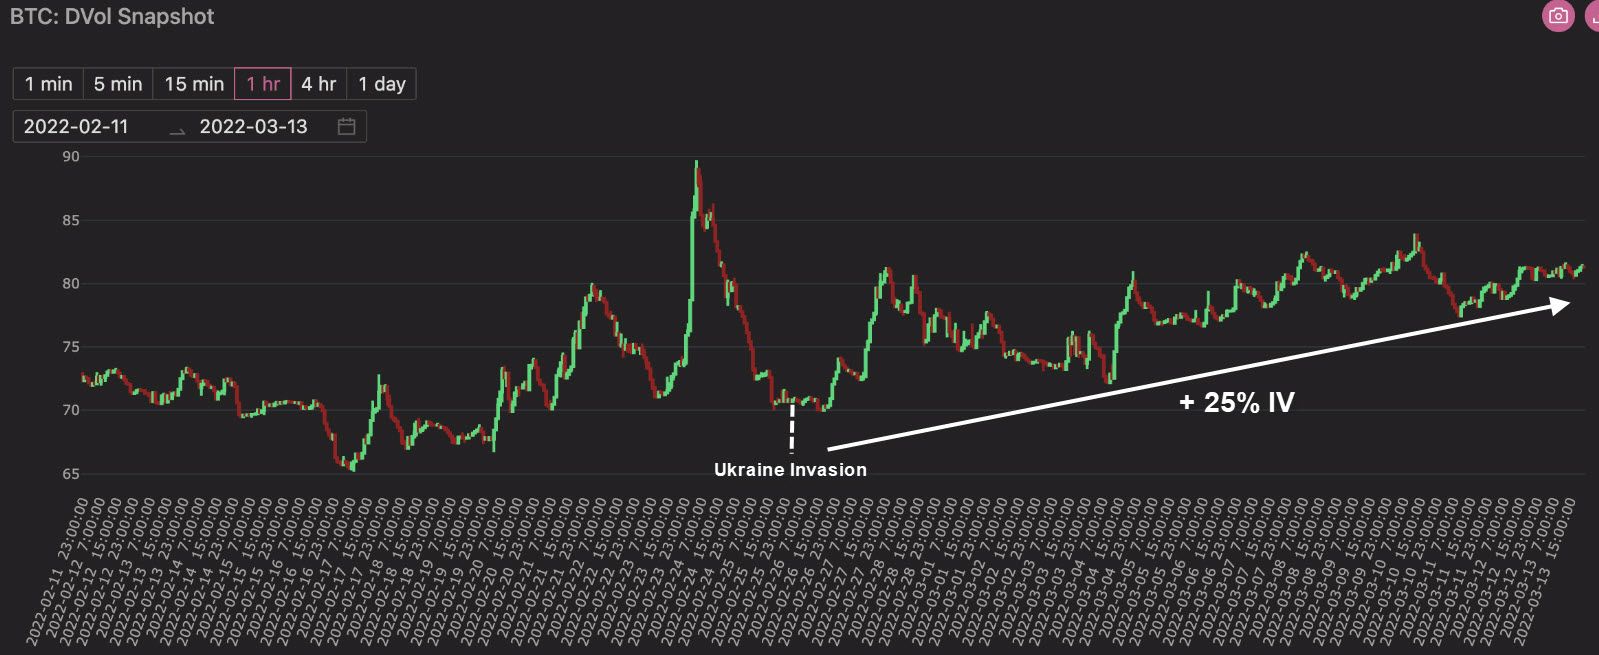
BTC's Muted Implied Volatility
- Bitcoin's Implied Volatility (IV) has lagged behind commodity asset classes since the start of the Ukraine invasion
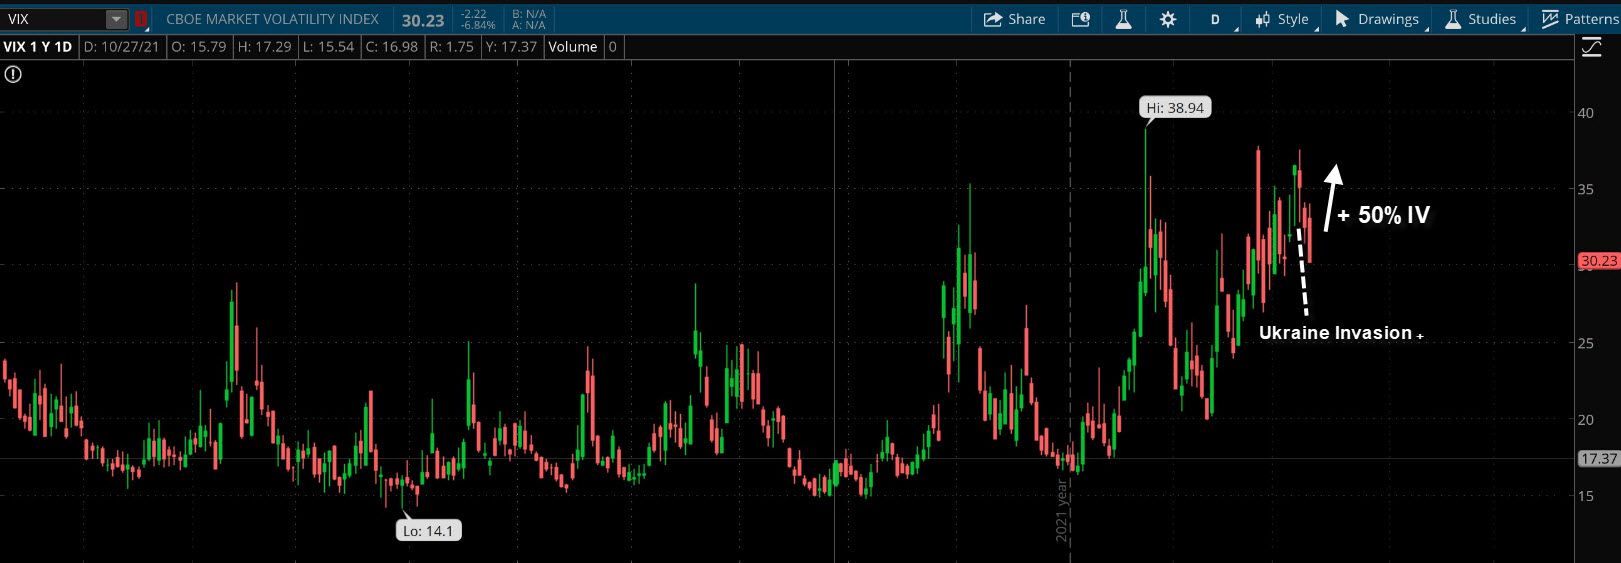
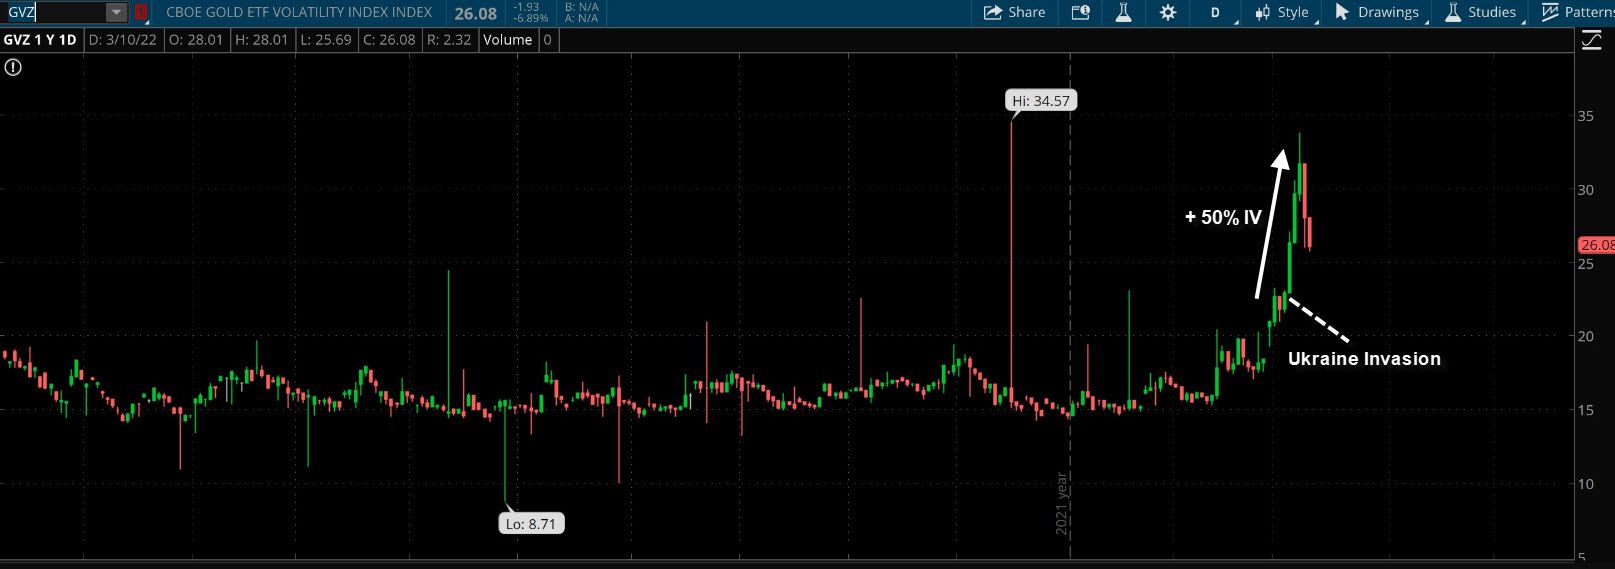
- Equity, Gold & Oil IV have all doubled since the start of the war while BTC's IV has only increased by 25%
- This indicates that BTC's volatility isn't impacted as much by geopolitical developments as other assets such as Oil, Equity or Gold
- BTC's IV still increased significantly due to its risk asset correlation, however less than the other asset classes due to idiosyncratic flows
BTC Implied Volatility
Equity Implied Volatility
Gold Implied Volatility
Oil Implied Volatility