
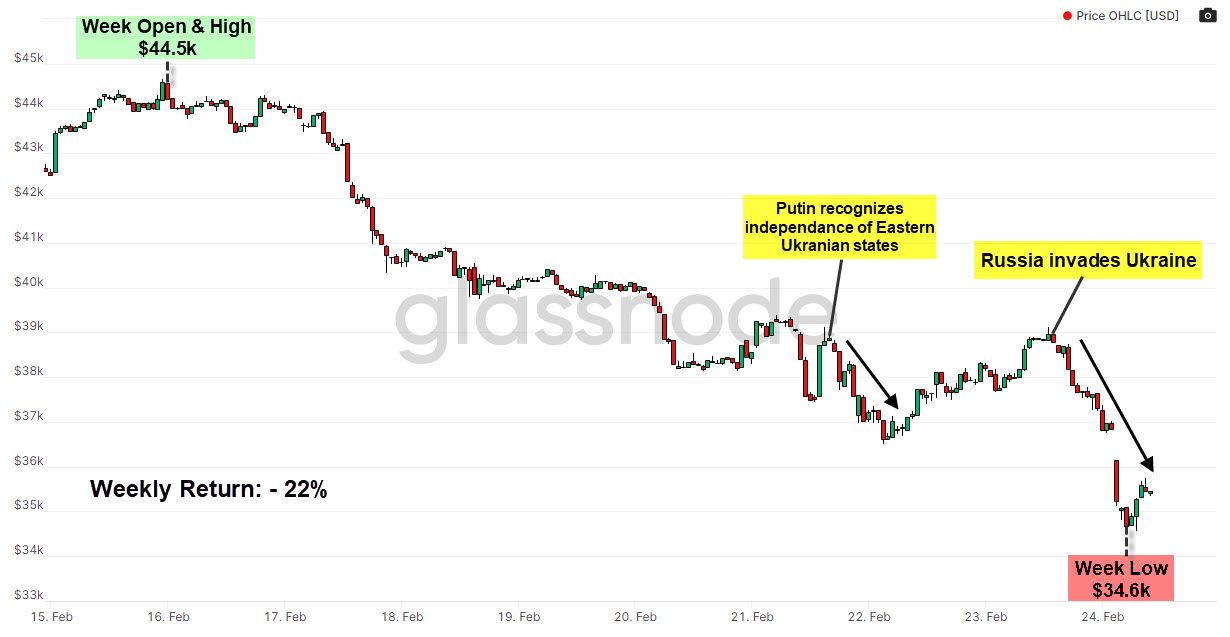
- BTC prices have dropped by 22% in the last week due to the escalation of the Ukraine-Russia conflict
- Investors continue to accumulate and hold Bitcoin despite the price drop
- Losses were realised by short-term traders who have grown highly uncertain of near-term price aciton
- The development of the conflict will determine whether the $33k level reached at the end of January truly was BTC's macro bottom
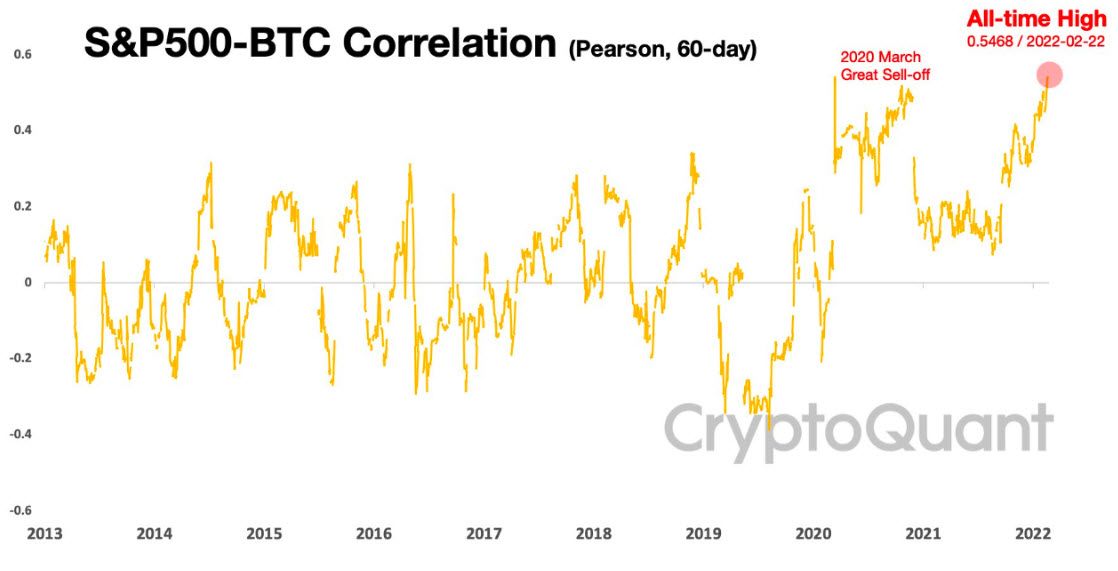
- BTC's correlation to equities reaches an all-time high and will persist as long as uncertainty looms in the macro environment
Weekly Price Action
- Bitcoin price has reached a monthly low of $34.6k after a week of heightened macro uncertainty
- Price opened at $44.5k and dropped by 22% and is currently trading at $35.2k
- We broke below the key support level of $40k and can expect prices to test the $32k level
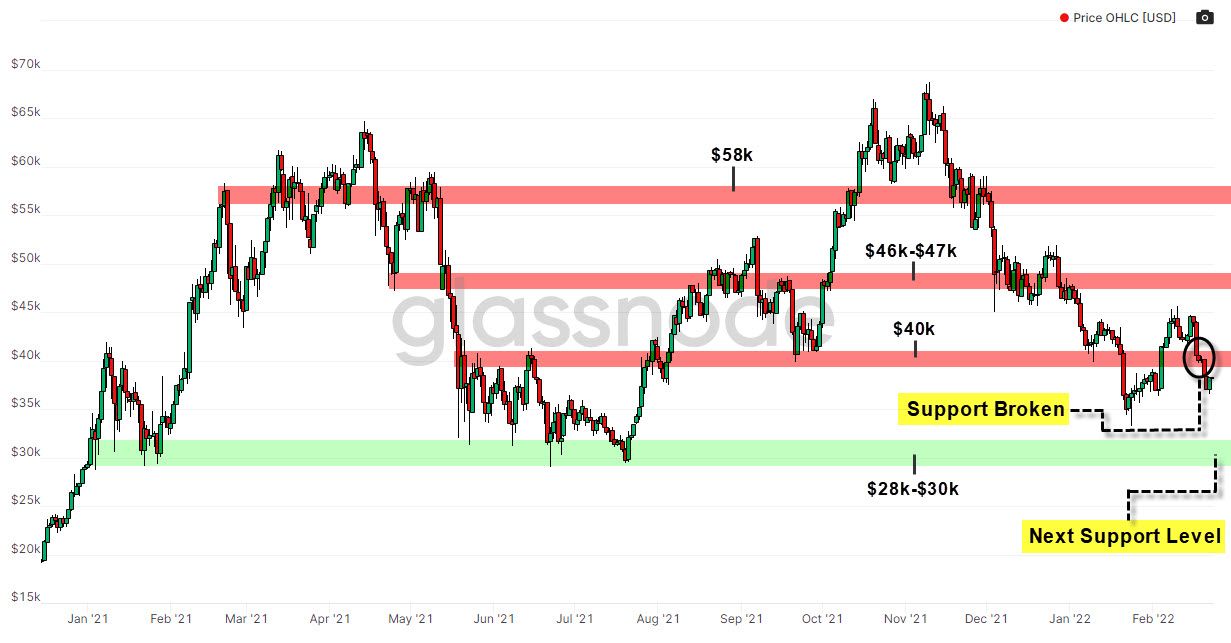
Price Structure
- Price broke below the key support level of $40k last week
- The next support level is estimated to be in the $28k-$30k range
Assessing sell-side pressure
- The market suffered from significant sell pressure in the last week which sent prices down to monthly lows
- This pressure was primarily caused by the increased uncertainty in the market, in light of the escalation of the Ukraine-Russia conflict and the impending rate hikes by the Federal Reserve
- We'll assess which investors drove price action and as well as the extent of the sell pressure
Exchange Net Postion Change
- This metric illustrates the 30d change of Bitcoin supply held on exchange wallets
- Extended periods of net increase in supply (green) is indicative of increased potential sell pressure, as coins are moved onto exchanges to be sold
- On the flip side, periods of net decrease in supply (red) signal the market's willingness to hold for the long-term by storing their Bitcoin off-exchange
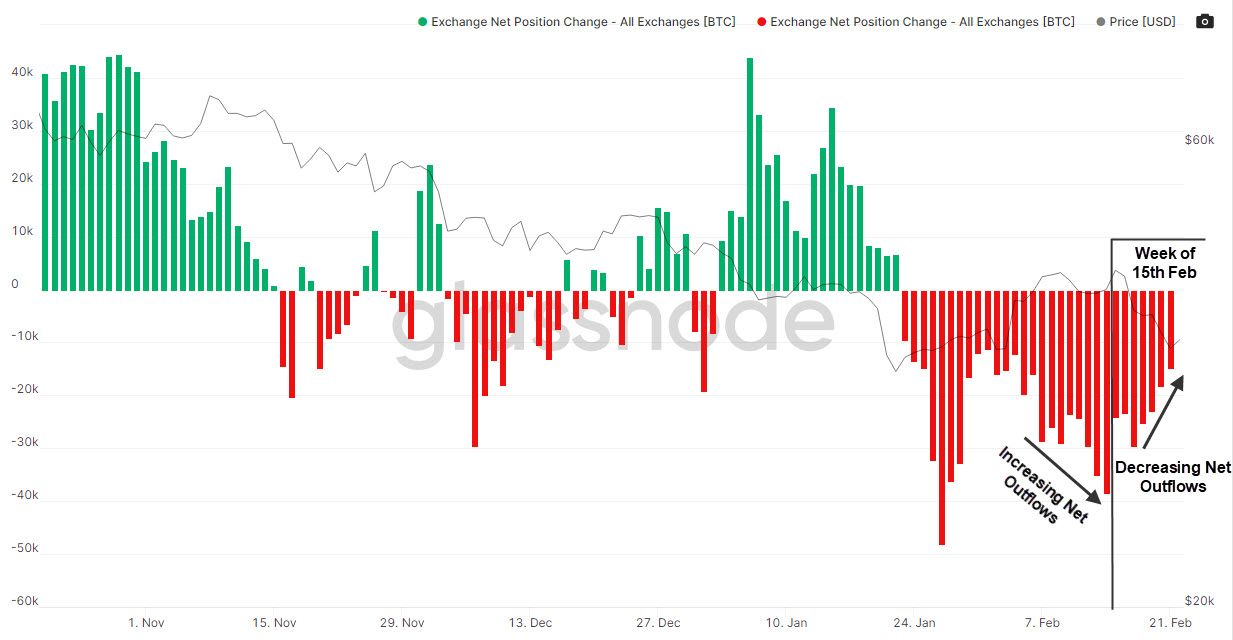
- After a week of increasing net outflows, there was a decrease observed this past week as many investors moved their coins onto exchanges to sell
- There is however still a regime of net outflows which exhibits an underlying demand to accumulate and hold Bitcoin for the long-term by the wider-market despite the drop in price
Who sold their Bitcoin ?
STH SOPR
- Short-Term Holders (STHs) are investors who have held their Bitcoin for less than a 155 days
- STH spent output profit ratio (SOPR) is a metric that measures the average realised profit or loss by STHs
- Values above 1.0 indicate net profit realised and values under 1.0 indicate net losses realised
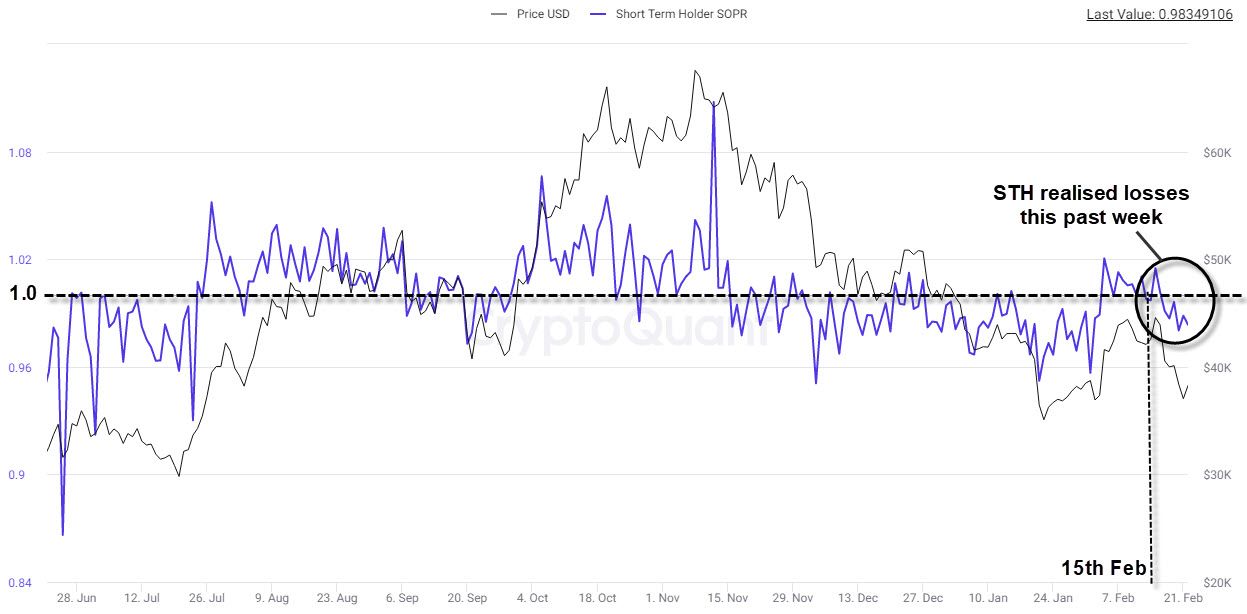
- After a week of net profitability, the metric trended below 1.0 as STHs incurred losses this past week due to the significant drop in prices
LTH SOPR
- Long-term holder (LTHs) are investors who have held their coins for more than 155 days
- LTH SOPR is a metric that measures the average realised profit or loss by LTHs
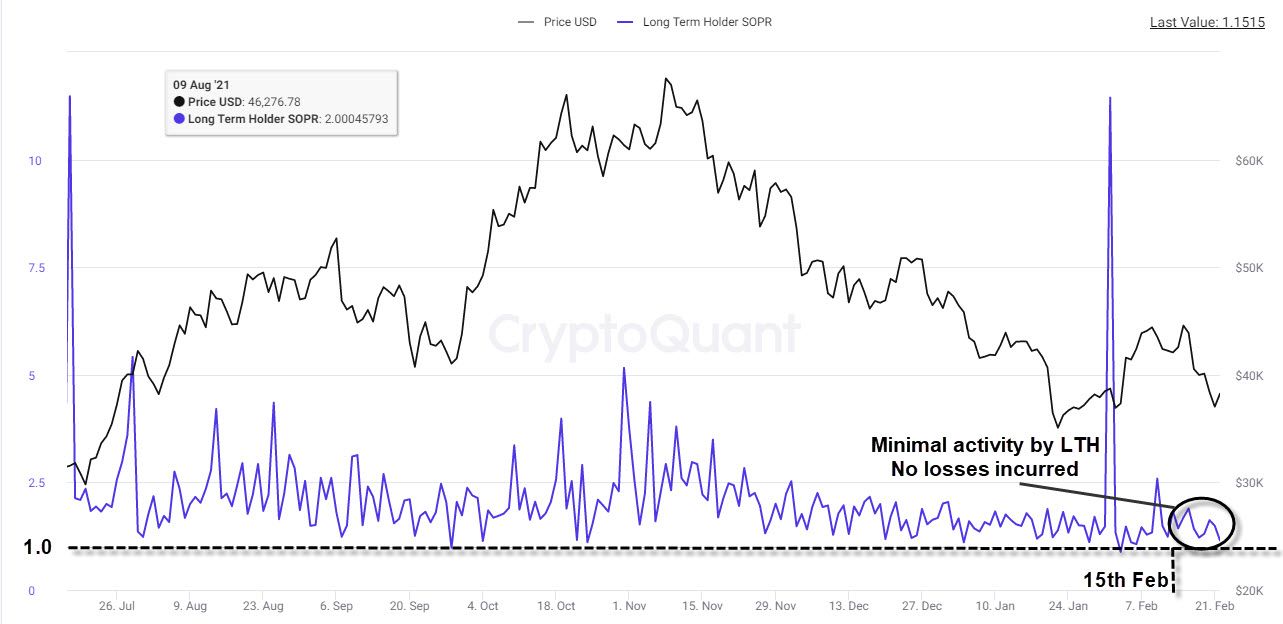
- LTHs continued to realise moderate profits as the metric remained in the range it has been trending in since price reached its all-time high in November
- This suggests that the selling pressure came from STHs who sold their Bitcoin amidst the macro uncertainty and realised the majority of the losses in the market
Risk-off Behaviour in Derivatives Markets
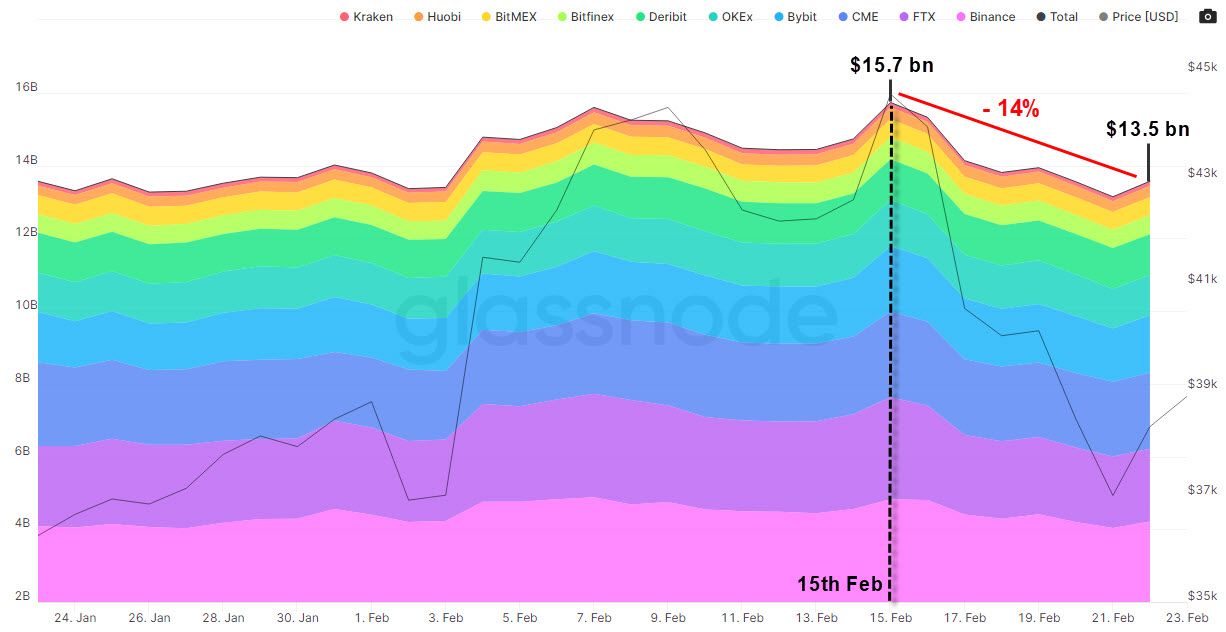
Futures Open Interest
- This metric illustrates the total amount of funds allocated in open futures contracts for Bitcoin
- The 15% drop in price was met with a 14% drop in Futures Open Interest
- Derivatives traders exhibited a risk-off behaviour by closing their positions given the macro uncertainties
- This removal of liquidity has reduced implied volatility to 61.5%, a low level relatively to the yearly average
Perpetual Futures Funding Rates
- Funding rates are the fees paid between traders to peg the futures price to the spot price
- Positive (green) funding rates indicate a net long bias by traders as they are willing to fund short traders
- Negative (red) funding rates indicate a net short bias by traders as they are willing to fund long traders
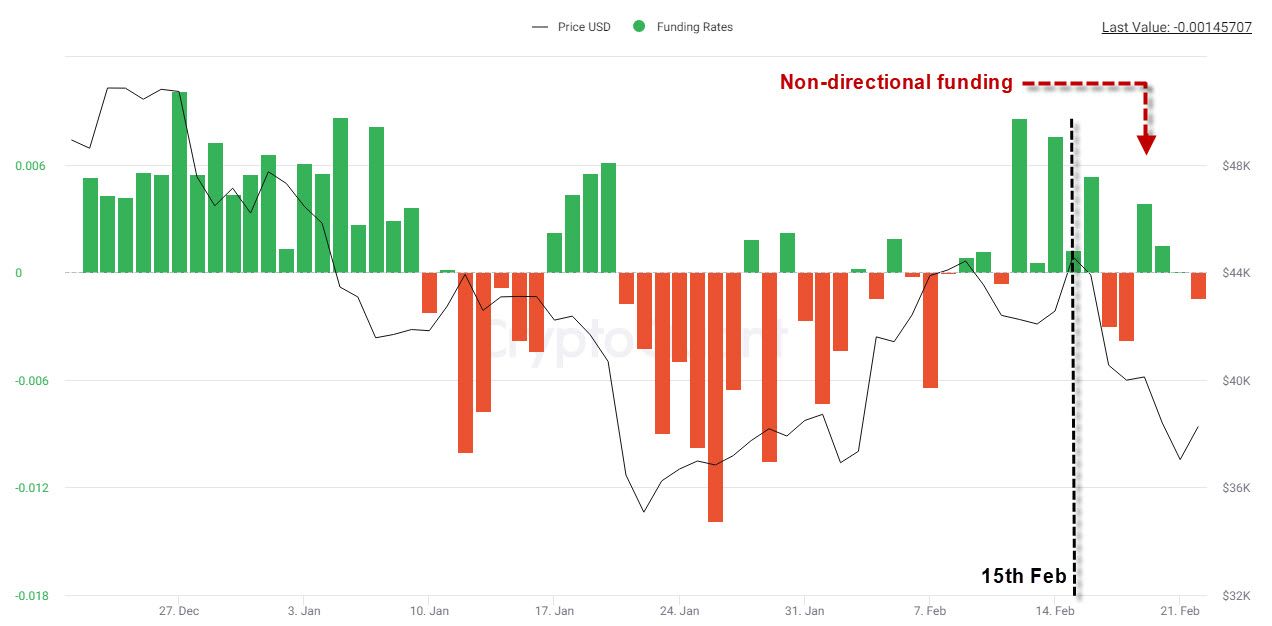
- This past week has seen mixed sentiment as funding rates fluctuated between positive and negative
- There is therefore no clear directionality that can be inferred from funding rates as traders have adopted a risk-off behaviour given the macro uncertainty
Where is the bottom ?
Price has been in a downtrend since reaching an all-time high (ATH) in November 2021 and has dropped by approximately 50%. Price isn't far from reaching the $29k low established in July 2021 after the May 2021 crash.
Since the downtrend began in November of 2021, price has failed to establish a bottom on numerous occasions including last week as prices had recovered from $33k to $45k before dropping back to $34k.
Our technical analysis suggests that $28k is the next support level in play. We can turn to 'Macro Trend Indicators' to assess the likelihood of price either reaching this support level or having already set a bottom.
Mayer Multiple
- The Mayer Multiple (MM) is a ratio between price and the 200d moving average
- Values above 1.0 indicate that price is above its 200d moving average and vice versa when values are under 1.0
- The metric has reliably signaled macro tops / bottoms as it takes into account the 200d moving average, which is an indicator often used to determine long-term trends
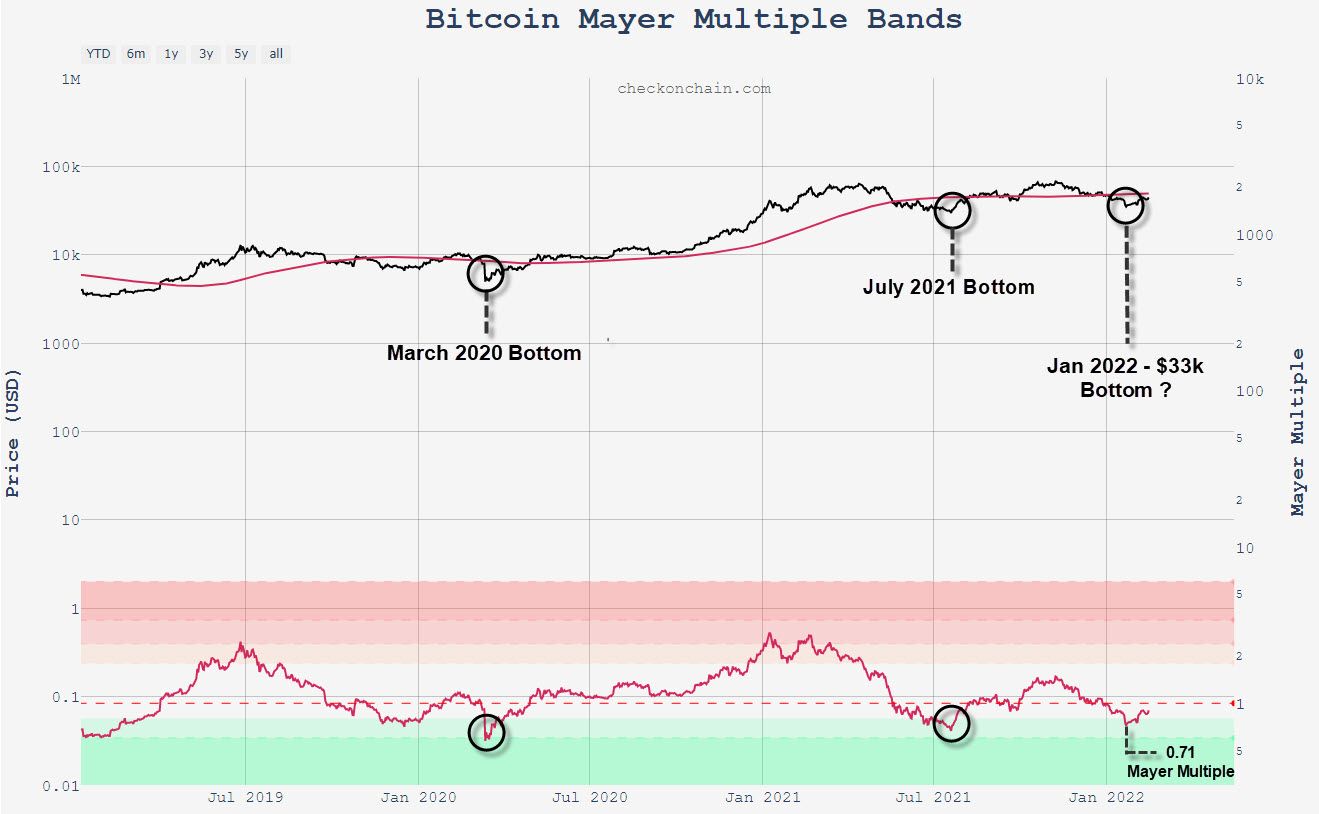
- The metric returned its lowest value at the end of January 2022 at 0.71 since March 2020 and July 2021
- The metric has recovered swiftly since and has climbed back up to 0.90
- As such, a macro bottom may have been set at $33k and the price recovery may be underway
- This thesis will be invalidated if the MM crosses below 0.71 again
Correlation to Equities
- Bitcoin's correlation to the S&P 500 has reached an all-time high
- The primary reason for this is due to the uncertainty in the macro environment as well as the lack of idiosyncratic flows to Bitcoin
- As such, Bitcoin traders are adopting a risk-off behaviour by limiting their speculation and deriving signals from movements in the equity markets
- This correlation is likely to persist as long as there is uncertainty in the macro environment as well as a lack of Bitcoin-specific developments
All eyes on Ukraine-Russia

- BTC price action will continue to be driven by STH traders as LTHs have held firmly onto their positions
- These STH traders are highly sensitive to price changes and are currently deriving most of their signals from the equity markets given the macro uncertainty and lack of idiosyncratic flows
- Traders in the equity markets are pricing in the expected impact of the Ukraine-Russia conflict
- BTC's short-term price movement is therefore highly contingent on how the conflict evolves
Summary
- Bitcoin has sold-off by 22% as uncertainty has mounted with the Ukraine-Russia conflict
- The next support level is $28k-$30k as the key $40k level has been broken
- Investors are accumulating Bitcoin and holding for the long-term as net outflows remain despite the sell-off
- This sell pressure came from STHs as they cut their positions to limit their losses
- Macro indicator suggests that price recovery is underway as $33k could be a macro bottom
- BTC is highly correlated with equity markets due to the macro uncertainty and the lack of idiosyncratic flows
