
- The Fed has confirmed a rate hike in March, which has the potential to provide the crypto market with enough regulatory certainty to rally
- A potential macro bottom has been set as a high concentration of investors have bought around the $37k area
- High leverage and a shift in bias to shorts have set conditions in place for a potential short squeeze
- Bitcoin liquidity is decreasing as outflows from exchanges is increasing
Weekly Price Action
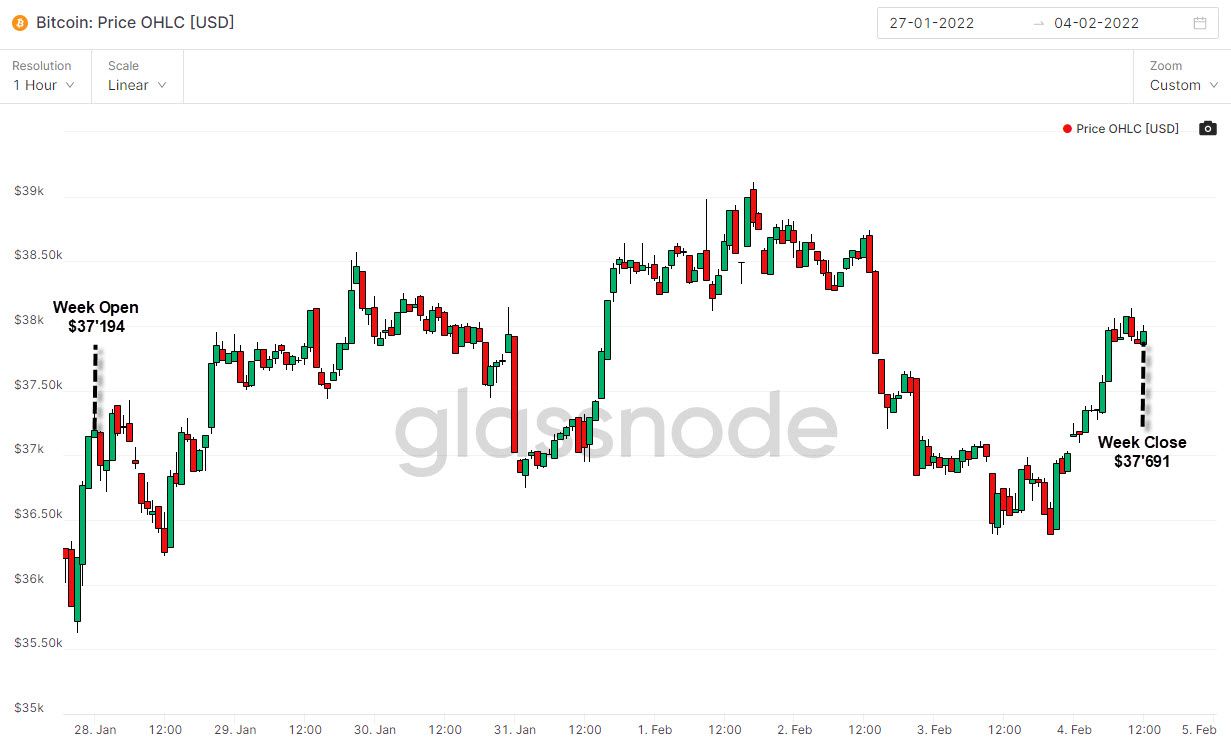
- Bitcoin traded within a tight range between $36k and $38.2k this week, with relative volatility
- Opened the week at $37.1k and ended it slightly higher at $37.6k
- Price action has continued its choppy, sideway action for a second week in a row
Potential Bounce ?
Many assets have downtrended since the start of the year, notably the Equity and Crypto markets, which have experienced one of their worst starts to a year. This is mainly due to the market front-running the Federal Reserve's policy change. The Fed's January meeting confirmed a rate-hike in March, which will provide markets a period of policy certainty until the rate hike occurs mid-March. This can potentially spur a bounce in the Crypto markets from the January lows.
There is a consistent narrative that can observed across on-chain data. The narrative is that high-conviction investors or HODLERs are continuing to buy from short-term traders who bought the top, despite the downtrend in Bitcoin.
Where is the bottom ?
Attempting to find a bottom during the current downtrend in Bitcoin is vital to understanding short-to-midterm price action. We can refer to a variety of on-chain data to help visualize this.
UTXO Realized Price Distribution
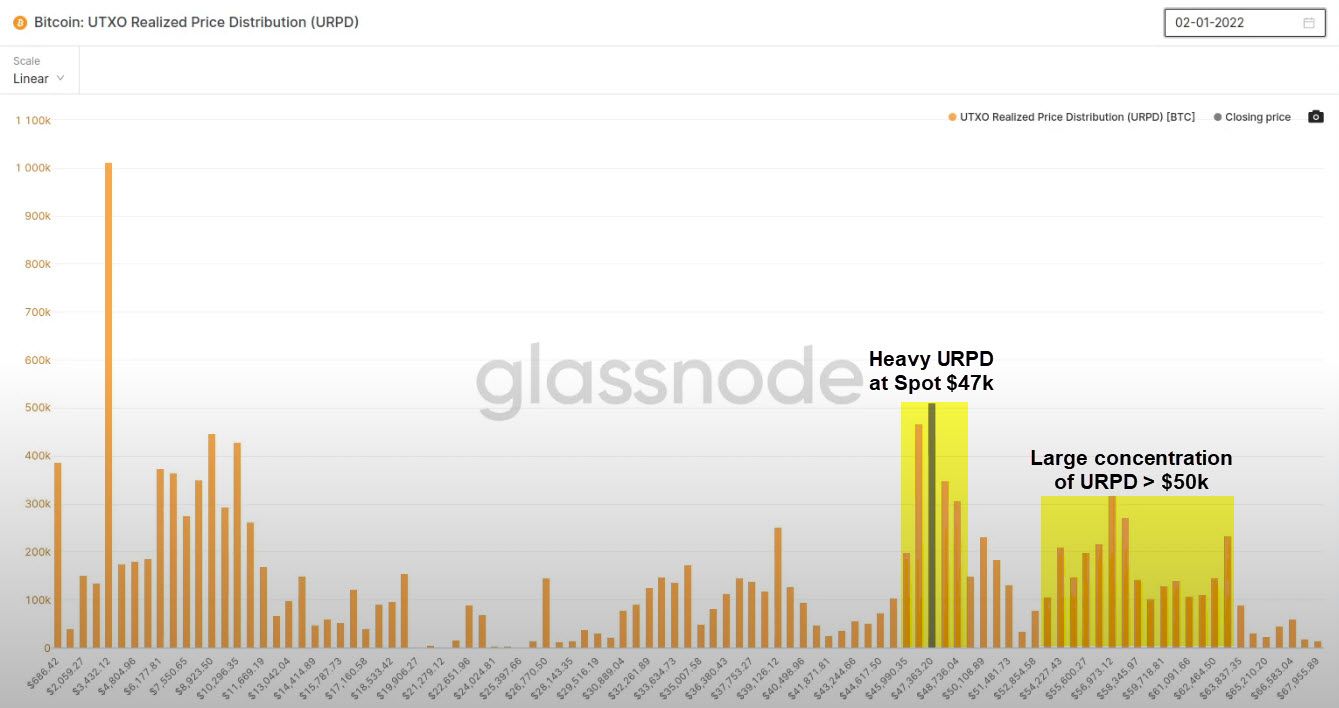
The UTXO** Realized Price Distribution (URPD) shows the price levels at which investors bought their Bitcoin. Each bar shows the amount of existing Bitcoins that last moved within that specified price level.
The first graph illustrates the URPD at the beginning of the month. We can observe a heavy distribution surrounding the $47k area, where the spot price was at the time as well as a large portion of URPD concentrated above $50k.
** UTXO stands for Unspent Transaction (TX) Output and refers to the amount of cryptocurrency remaining after a cryptocurrency transaction is executed
The second graph illustrates the URPD at the end of January, after Bitcoin's price declined by approximately 20%. There was a significant shift in the concentration of URPD as a result, from the $47k level to the $37k area. Investors with high conviction for the long-term likely found value at the $37k area and stepped in as a result to buy at a discount, and consolidate a local support level. It is yet to be seen if this support will result in a macro bottom.
Interestingly, the URPD distribution above $50k remained largely unchanged throughout the month, despite the price decline. This cohort of investors remained unfazed throughout the month and are likely to hold their positions for the long-term.
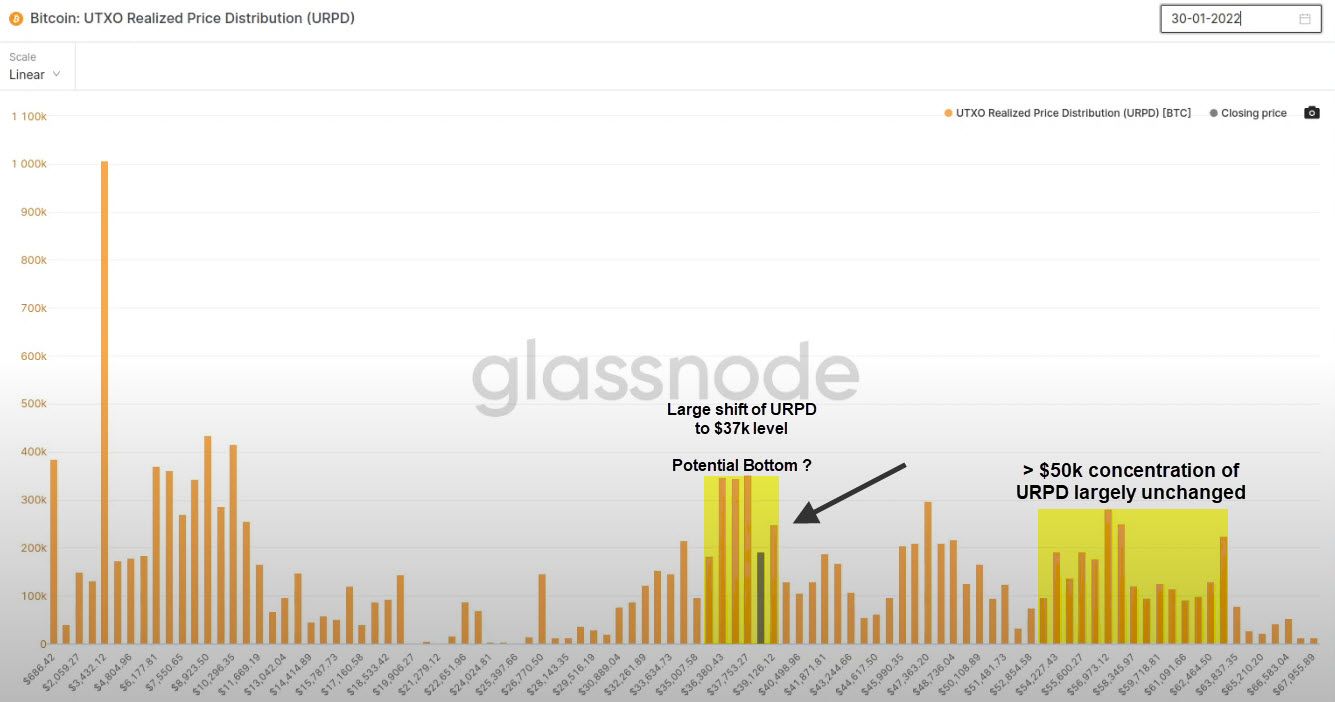
These two observations are constructive for Bitcoin's near-term price action as a potential macro bottom may have been established at the $37k level, with the support of a cohort of investors that bought above current price levels.
Potential Short Squeeze ?
Various on-chain metrics suggest that market conditions are in place for a potential squeeze of shorts that would push prices higher:
- Perpetual Futures Open Interest is near record highs
- Perpetual Futures Funding Rates have turned negative throughout January
- Options Open Interest Put / Call ratio has switched to Put dominance
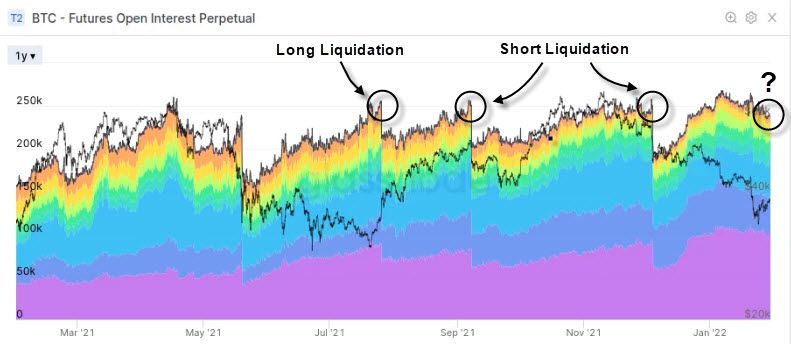
Perpetual Futures Open Interest
'Perpetual Futures Open Interest' has sustained record high levels during the month of January. These levels always imply an excessive amount of leverage in the market, and have in the past year resulted in the liquidation of either shorts or longs.
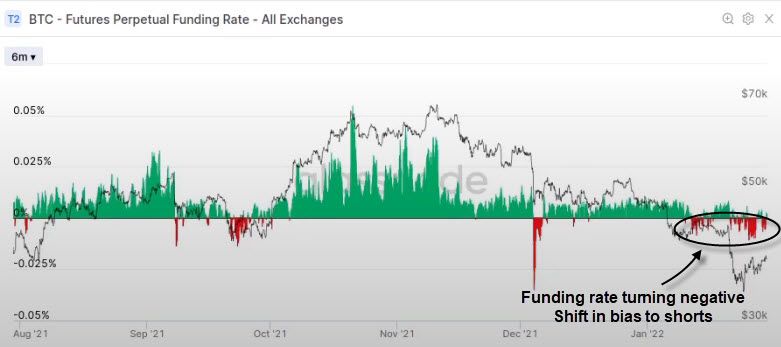
Futures Perpetual Funding Rate
We can view the 'Futures Perpetual Funding Rate' to understand the directional bias in the market, and therefore the likelihood of a long or short squeeze, given the record high open interest in the Bitcoin market.
There has been a shift in bias during January, as funding rates have turned negative. Despite the price recovery from the $33k lows, investors have continued to go short, a usual occurence before a short squeeze.
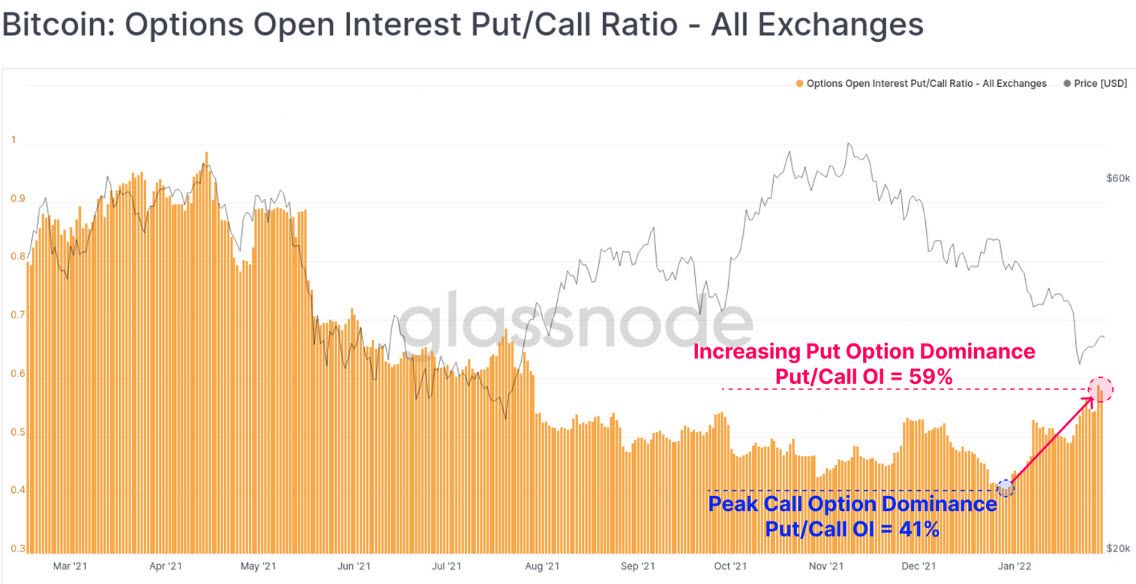
Options Open Interest Put/Call Ratio
This is another metric to describe the directional bias derivatives traders currently have for shorts. The metric describes the ratio between Put & Call volume allocated in options contracts.
The ratio shifted signficantly from Call to Put dominance since the new year. This confirms that derivatives traders are seeking insurance to further downside price action despite Bitcoin trading at 6 month lows.
The shifts in bias from long to short and in long to short liquidation dominance points to an observable change in sentiment in the derivatives markets. The combination of high negativity, high leverage and short bias all make for a potential trend reversing short squeeze.
'Hodling'** Persists
There are significant exchange outflows that can be observed across several on chain metrics, suggesting demand from high-conviction investors.
- Significant outflows observed in Net Transfer Volume from / to Exchanges
- % Balance on Exchange is reaching multi-year lows
- Illiquid Supply has continued to trend up
** Hodling is a term derived by misspelling 'holding' and is used by cryptocurrency investors and refers to holding a cryptocurrency for the long-term
Net Transfer Volume from / to Exchanges
This metric descibes the net flow of Bitcoins from or to exchanges. We can observe a significant outflow of Bitcoins from exchanges, particularly in the last two weeks. These outflows have been increasing as price has declined, confirming the demand for Bitcoin at current price levels.
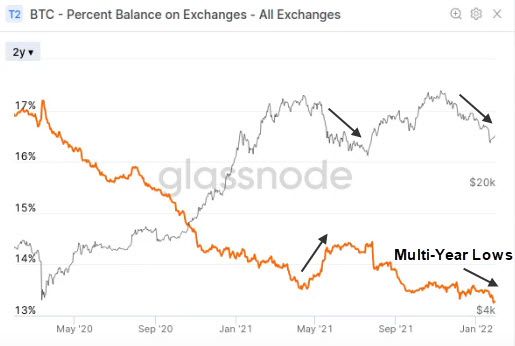
Percent Balance on Exchanges
The percent of supply held on exchanges is reaching multi-year lows given the large amount of coins leaving exchanges. This points to the large amount of value demand (hodling) in the market as prices fall on a macro scale.
Interestingly, balance on exchanges have continued to trend lower since the November all-time high, unlike the upward trend observed after the all-time highs in May. Despite similar drawdowns, the trends in exchange reserves and coin liquidity have trended in opposite directions. This points to a more bullish undertone this time around, as fewer coins are being spent out of fear and are instead stored for the long-term.
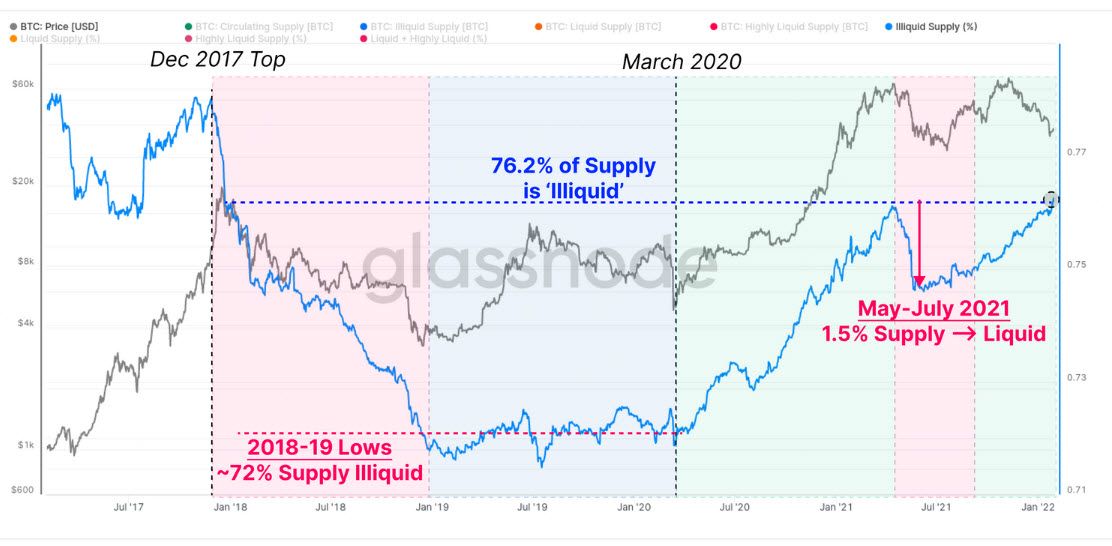
Illiquid** Supply
Illiquid Supply has continued to trend up and has returned to its highest level (76.2%) since December 2017. Prices have continued to decline despite the market's tendency to accumulate coins, which points to a potential bullish supply divergence.
The demand from high-conviction / long-term investors is apparent across the various exchange metrics. The combination of coins leaving exchanges, long-term investors holding and the uptrend in illiquid supply despite declining prices all suggests that investors consider current price action as an opportunity to accumulate.
** Illiquid coins are those that are stored off-exchange, in cold storage and are unlikely to be moved or spent, thereby making them illiquid
Signals to watch for a relief bounce
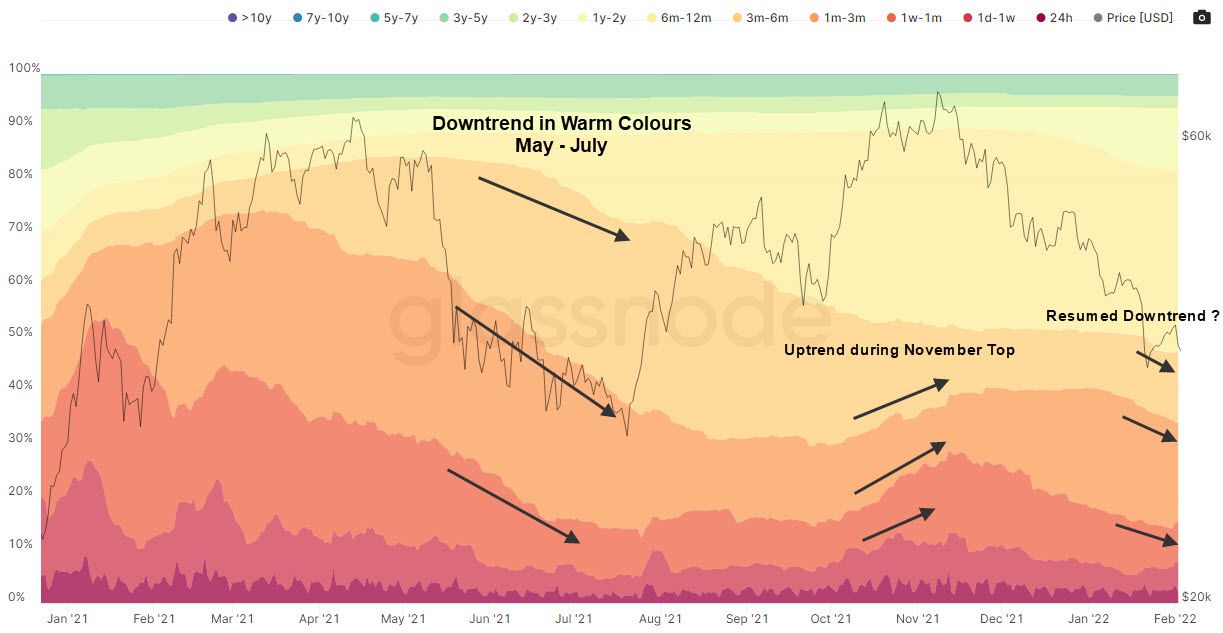
Realised Cap Hodl Waves
This metric denotes the proportion of coin supply based on how long they have been held. The warmer the colours the younger the coins.
There was a downtrend in warmer colours during the May-July bear market as investors were accumulating. This was followed by an uptrend in these colors during the November top, as investors sold off their positions and increased the supply of younger coins.
The downward trend in warmer colours has resumed, indicating the potential for a July like bottom. A persistent downtrend in warmer colours is needed to confirm this reversal.
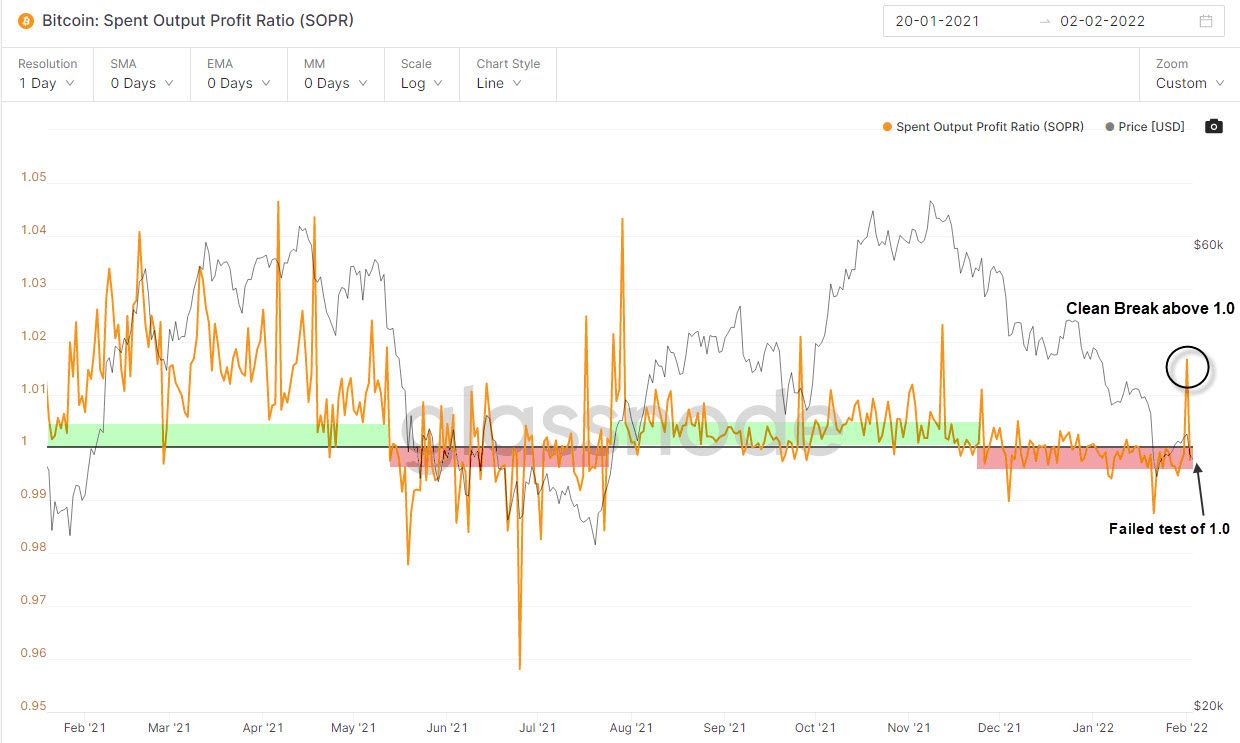
Spent Output Profit Ratio** (SOPR)
The Spent Output Profit Ratio describes the net profitability in the market. Values above 1.0 represent net profitability in the market, with values below 1 representing net loss in the market.
The metric bounces up off 1.0 during bull markets as investors tend to buy back when they're flat. These instances are marked in green below. During bear market, the metric bounces below 1.0 as indicated in red below, as investors tend to sell when they're position becomes flat to gain exit liquidity.
The metric has been trending below 1.0 since December 2021. A clean break above 1.0 and a retest from above will confirm a bullish uptrend.
There was a clean break above 1.0 recently, but the metric failed to test 1.0 as it dipped below again and is currently at 0.99.
** Spent Output Profit Ratio provides insight into macro market sentiment, profitability and losses taken over a particular time-frame. In other words, it reflects the degree of realised profit for all coins moved on-chain.
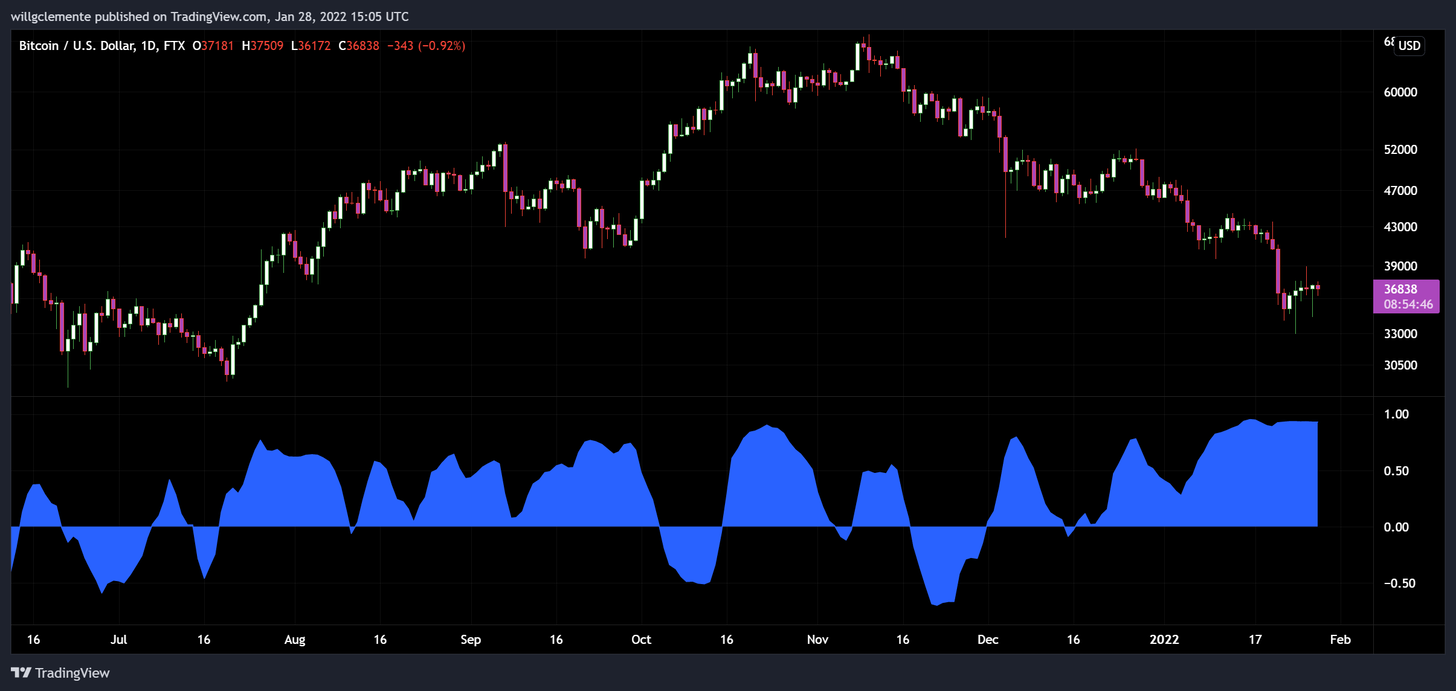
Correlation to Equities
The catalyst for a trend reversal remains in the macro. The correlation of the Bitcoin market to equities has been very high since the new year, largely due to a lack of idiosyncratic flows to Bitcoin.
A news headline specific to Bitcoin will help decouple the asset to the equity market and provide more clarity on its near-term price action. Until then, the asset will continue to trade tightly with equities, as illustrated by the blue indicator below.
Conclusion
There is still a bear bias for near term price action as we have dipped below $37k at the time of writing. There is however bullish undertone developing in the market. We observed that:
- A potential bottom may have been established as seen with the UTXO Distribution of Realized Price
- There is a high level of Open Interest coupled with a significant short bias, which has instored conditions for a potential short squeeze
- There is an underlying demand profile in the market as Bitcoins are flowing out of exchanges to be held for the long-term
These factors enable us to understand the potential for a trend reversal and are important to monitor along with new developments in the macro.
