Bitcoin
Weekly Price Action
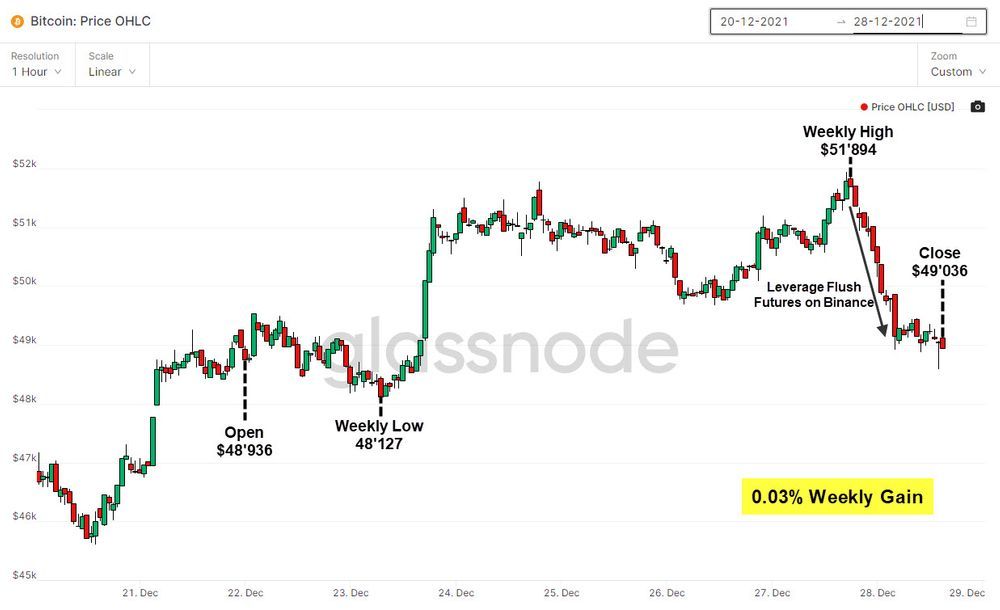
- Prices traded within a tight range for a third consecutive, with a weekly gain of 0.03%
- Prices grinded slowly upwards, breaking 50k levels
- Excessive leverage in futures markets caused a flush out from 51k to 49k in 24 hours
Technical Analysis
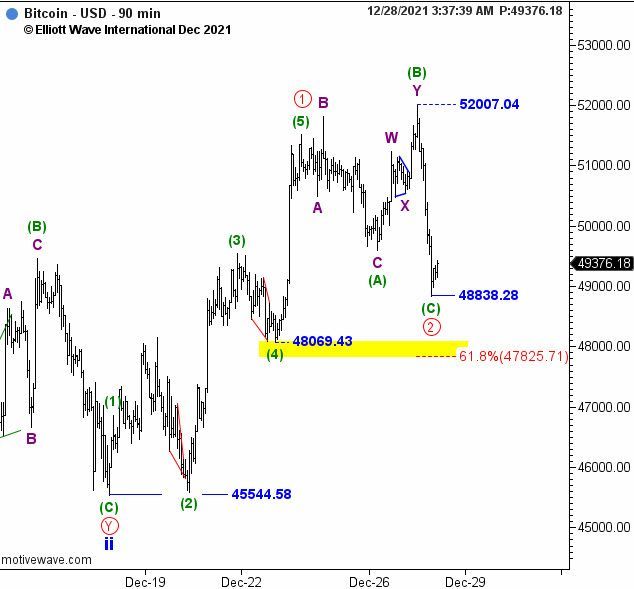
- Support is expected to be found at $47'825 according to the 0.618% Fibonacci retracement level of wave ((1)), if wave ((2)) isn't complete
- This zone is highlighted in yellow
- Wave (1) is then expected to chart an upward path, back above $50k
On-Chain Activity
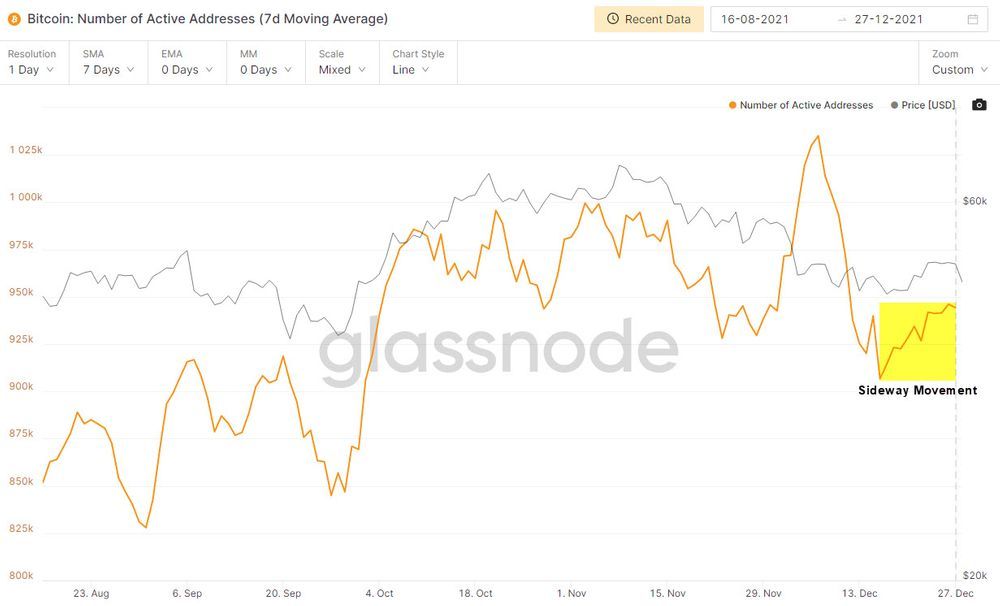
On-chain activity has remained stable as volumes are down and price is moving sideways. There hasn't been a signficant change in any of the major on-chain, fundamental metrics, indicating that investors are preferring to stay neutral towards the year-end.
Number of Active Addresses
We can observe a continued sideway movement in the number of active addresses on the Bitcoin network.
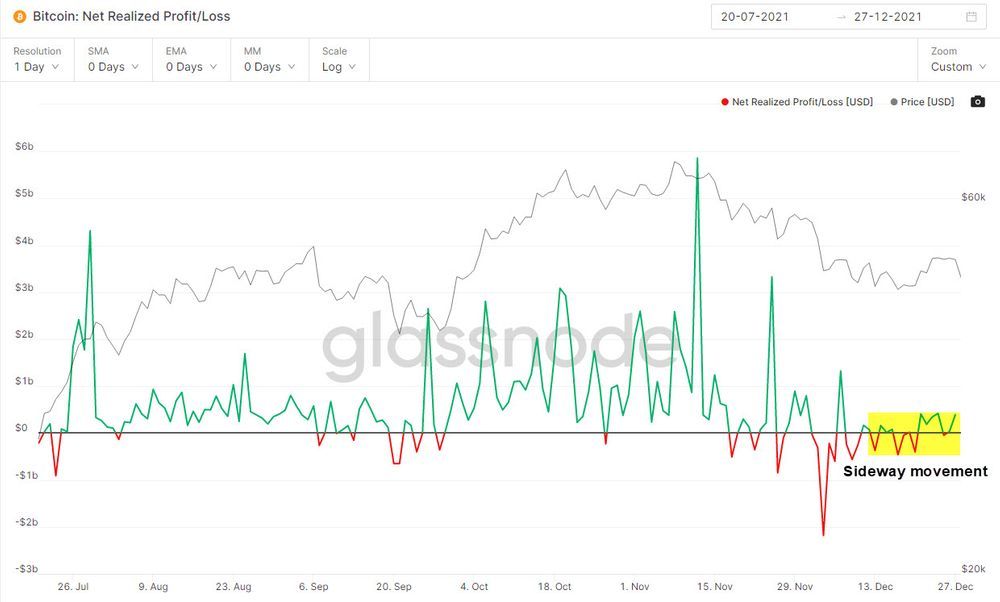
Net Realized Profit/Loss
After the realization of significant profits and losses since late November, the metric has remained muted.
Short-Term Holder (STH) SOPR
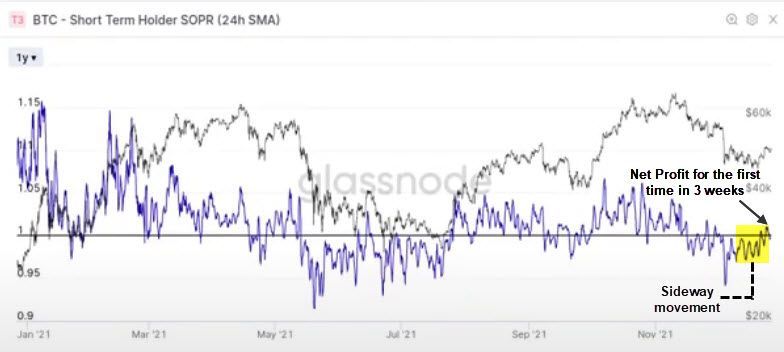
We noted last week that the market was primarily driven by Short-Term Holders (STHs). It is therefore useful to view the STH SOPR, as we can infer STHs behaviour in the near-term. This metric describes whether investors incurred on average, net losses or profits on any given day.
Since the leverage flush in early December, STH have incurred net losses as the metric has ranged below 1. The metric has recently just crossed back above 1, suggestng that STHs are finally becoming profitable on average, as prices are reaching the top of the range they have been consolidating in.
The risk of loss-stopping sell pressure is reduced as such. This may be an indication that a floor has been established, as STHs have held on to their underwater investments, and are likely to keep holding for higher prices.
Bitcoin Futures Open Interest
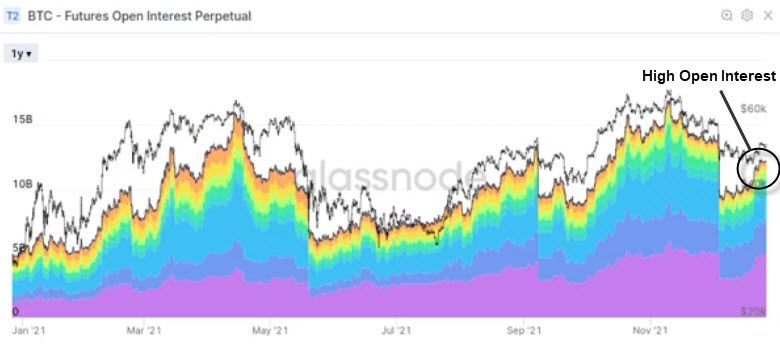
Open interest in Bitcoin Futures gradually increased since the December 4th leverage flush. In recent days, the metric spiked by 15%, from $3bn to $4.5, indicating that a lot of leverage had been layered.
That is why $90 million worth of Bitcoin long positions were liquidated over 24 hours on the 27th of December. This is because prices dropped enough to trigger the liquidation of long positions which caused the subsequent liquidation of other contracts and a cascading leverage flush.
This is what triggered the recent decline (-5.5%) in Bitcoin's price. The majority of these contracts were opened on Binance, an exchange that caters to retail investors.
Bottom in sight ?
Prices have ranged and consolidated within the $45k-$50k range for a third consecutive week. The main question now remains whether this range represents a bottom for prices, or whether there is potential for further downside price action.
UTXO Realized Price Distribution
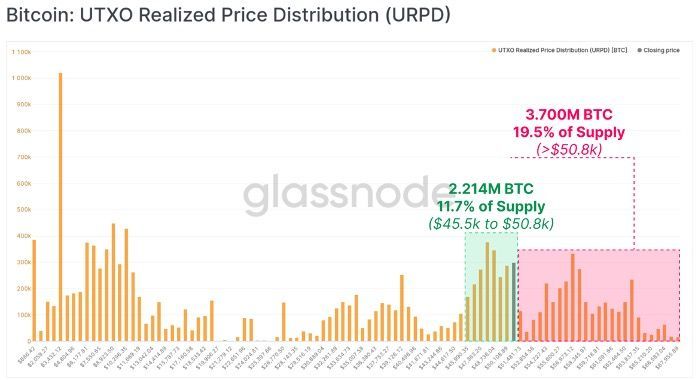
This metric describes the distribution of volume across all price levels at which all the supply of Bitcoin was last purchased. This metric provides a good perspective on where prices could potentially bottom or top.
We can observe a growing cluster of coins purchased in the $45.5k-$50.8k consolidation range. This area is highlighted in green and represents 11.7% of the total supply of Bitcoin. Traders and notably STHs have bought and sold signficantly at these price intervals in recent weeks. That is why this zone has acted as a reliable floor in recent weeks, as STHs are willing to buy at these levels and provide demand pressure.
Bitcoin: Percent Supply in Profit
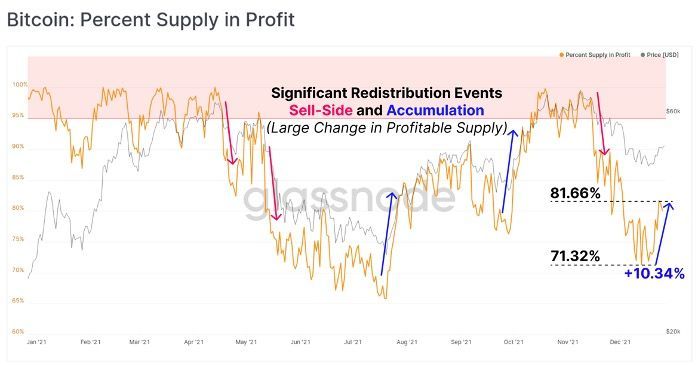
This metric describes the percent of all the supply of Bitcoin in profit. The metric has spiked in recent days by 10.34% as prices neared the top of the consolidation zone around $50K. This suggests that a lot of Bitcoins were bought at the bottom of the consoldation range, at around $45k, as the metric was sensitive to a slight increase in price.
Recent bottoms have always been succeeded by large spikes in the percent of Bitcoin supply that was in profit, such as in July and September 2021, indicated with the blue arow.
If these price levels truly represent a bottom, the recent spike in the metric may represent the start of a large uptrend.
