
- On-Chain Macro structure is still bullish
- Short-term correction extended to $55k level
- Micro indicators point to downtrend reversal soon
Bitcoin
Weekly Price Action
- Price suffered a major drawdown from $65k levels and found support at the $60k levels
- Market expected a swift reversal however prices descended again, this time to $56k levels, a monthly low
- Price has traded sideaways since, ranging between $56k - $60k levels and currently sits at $56.8k at the time of writing

Macro Outlook Remains Bullish
Despite the price correction Bitcoin has experienced in the last week, on-chain fundamentals still paint a bullish outlook for the upcoming months.
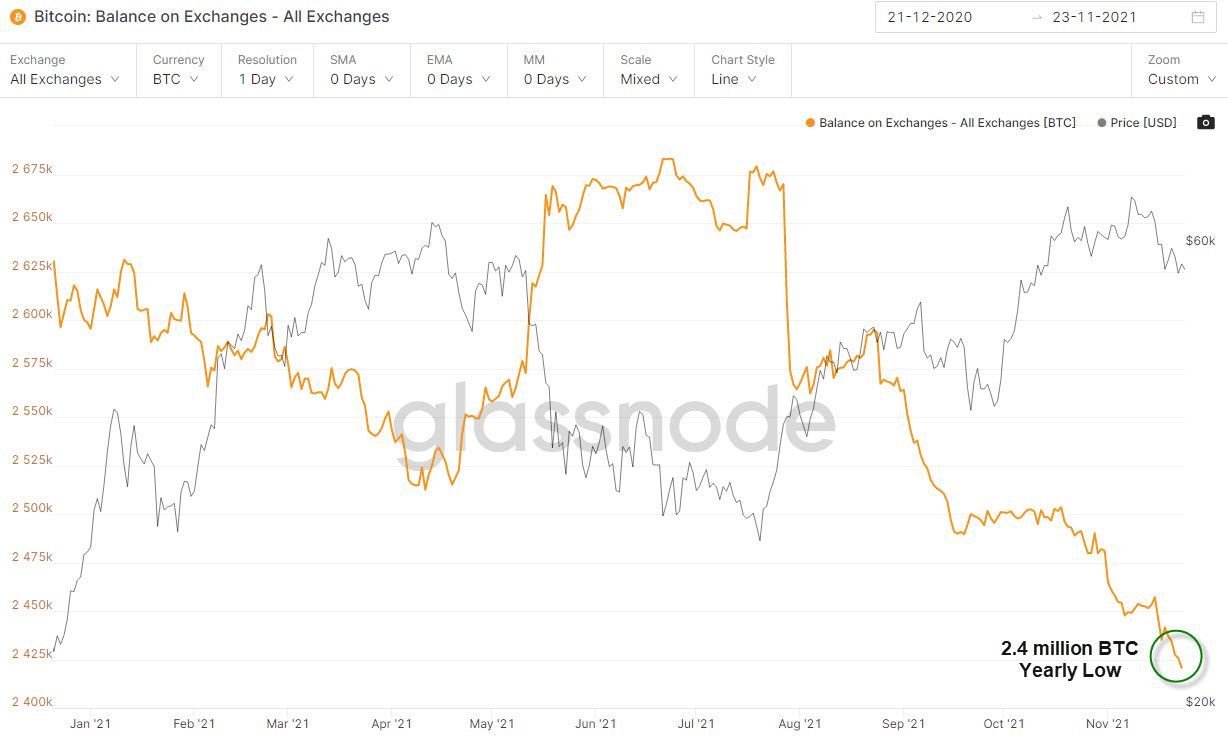
All Exchange Reserve
This metric describes the total amount of Bitcoin available on exchanges to be traded. The amount of Bitcoin available on exchanges is currently at a yearly low of 2.4 million BTC.
This is bullish for the long-term as it indicates that most Bitcoin holders are opting to store their Bitcoins off-exchanges, in cold storage for the long-term. The risk of a bear market inducing sell off is therefore very low.
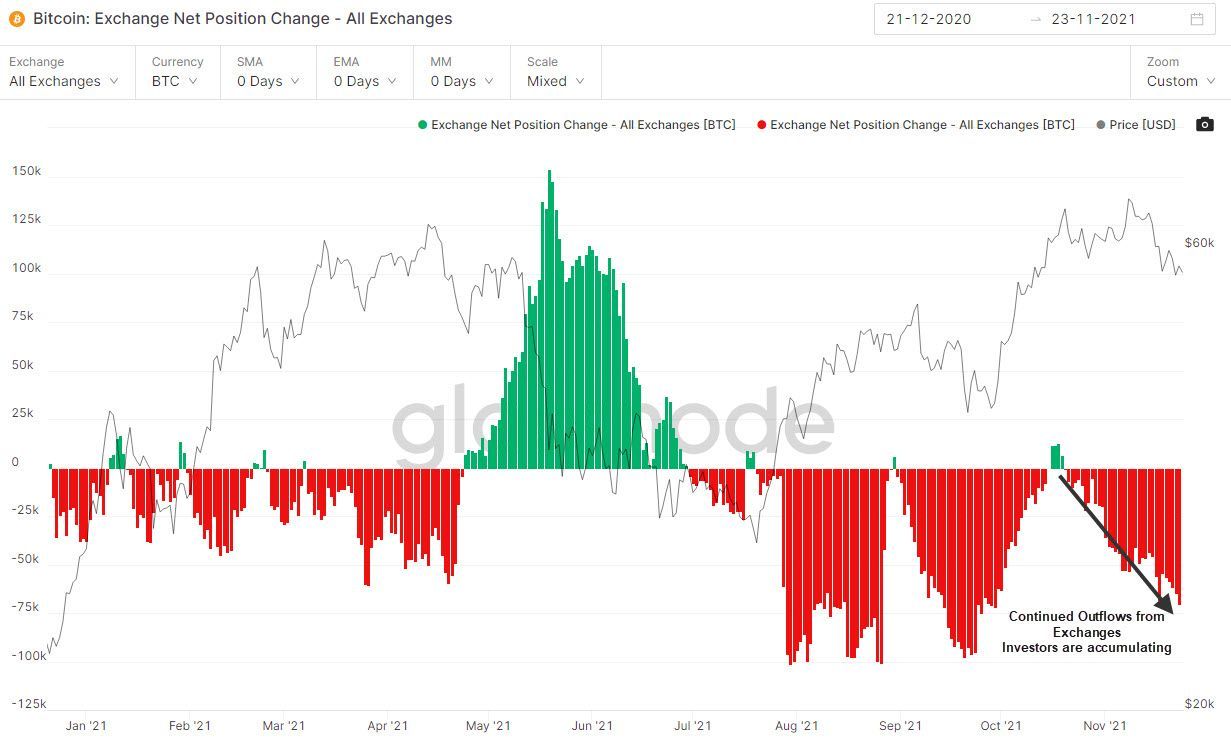
Exchange Net Position Change
The exchange net position change describes in detail the daily net flows from and to exchanges. We can observe that there has been an increasing amount of Bitcoins flowing out of exchanges in the last month.
This confirms the observation in the previous metric that most investors are accumulating their Bitcoins for the long-term. This is very constructive for Bitcoin prices in the long-term.
The Bull market is therefore still very much alive. Mid-term price corrections during bullruns are not an abnormal occurence and at times can be healthy for the market as overly speculative or leveraged investors are weeded out.
Downtrend to Reverse Soon ?
By assessing the current depth of the correction, prices are due for a reversal upwards based on the following factors:
- Technical Analysis
- Sentiment Analysis
- Derivatives Market Analysis
- On-Chain Fundamentals
- Whale Behaviour
These factors all suggest that the current depth of the correction is close to reaching its limit, and that the macro uptrend will resume.
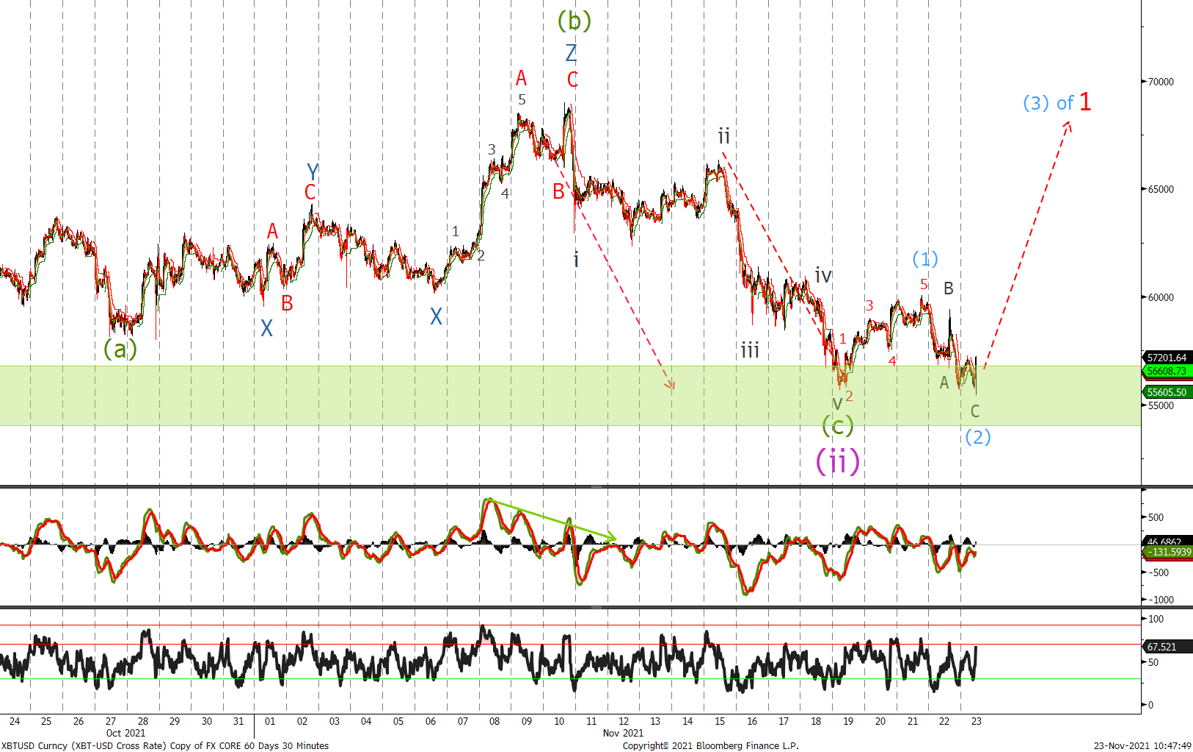
Technical Analysis
Based on the daily Bitcoin chart, prices seems to have found support at the $55k level and are due to reverse upwards. The support zone highlighted in green was tested last week and resulted in prices rebounding up to $60k.
Current wave counts suggests that price will bounce again from $56k and form wave (3) upwards.
Sentiment Analysis
Sentiment observed across social media platforms is an important aspect of the cryptocurrency market to monitor. Chatter amongst investors online has proven to partially drive price action in the cryptocurrency markets.
Santiment is a network intelligence platform that tracks market behaviour. It collects and processes data from more than a 1000 social media channels including Twitter, Reddit and Discord, to provide insights on market sentiment.
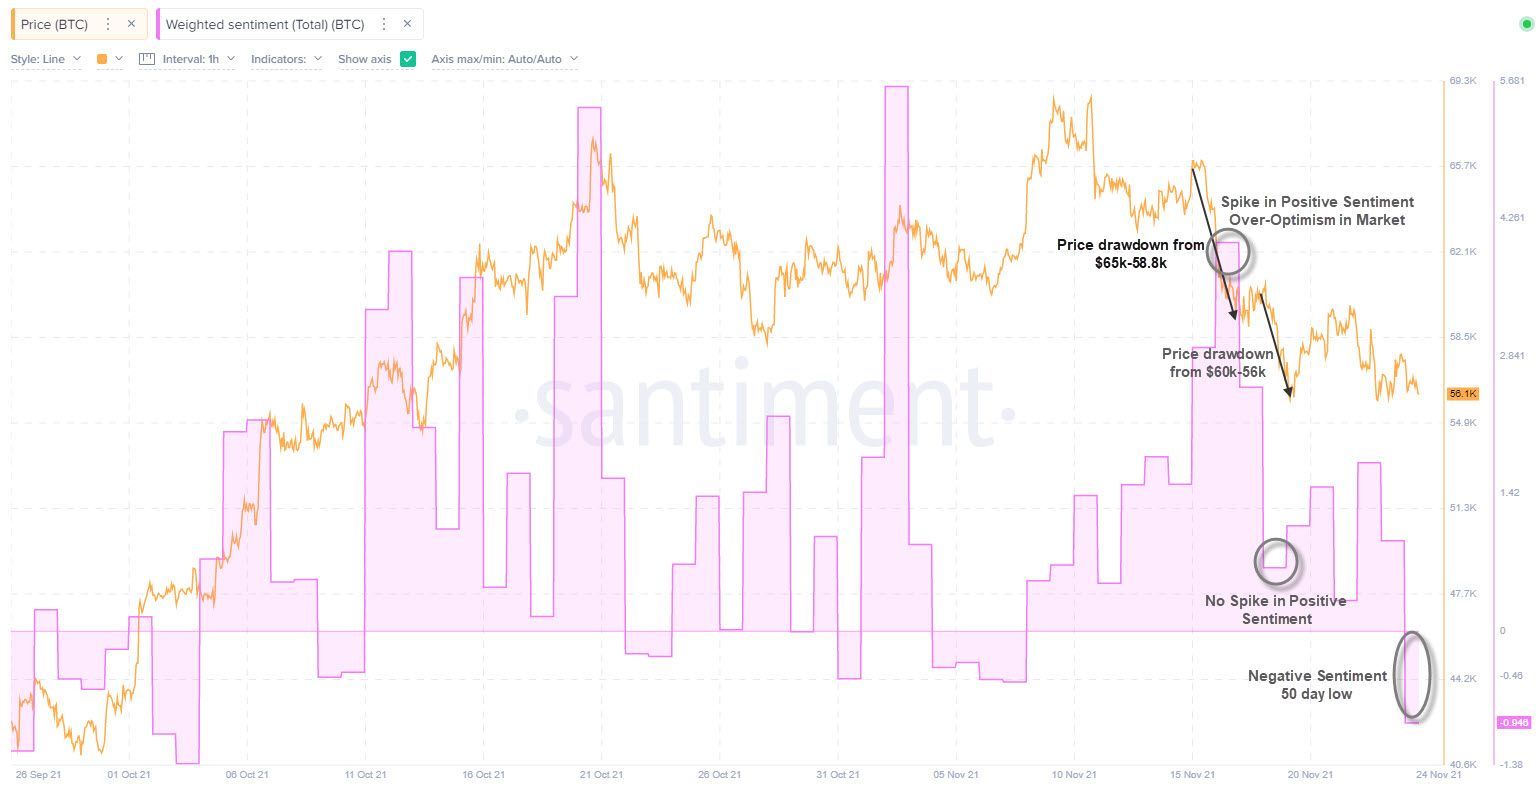
Weighted Sentiment
Weighted sentiment describes the difference between positive and negative chatter about Bitcoin across all social media channels monitored, adjusted for Bitcoin mentions. Positive values indicate that crowd sentiment is bullish on average and vice versa. The bigger the spike/dip, the more extreme the sentiment.
Following the price drop from $65k to $60k last week, the market remained bullish and expected a quick recovery, as positive sentiment spiked. Prices did not recover and in fact dipped again, this time from $60k to $56k.
The same didn't occur with the most recent dip from $60k-56k as weighted market sentiment didn't spike as investors were less confident in a swift price recovery this time. Sentiment on Bitcoin has since continued to decline and is now currently at a 50-day low.
The market is currently less bullish and more anxious following the second price dip.
'Buy the Dip' mentions
We can confirm the anxiety in the market by viewing the amount of ‘buy the dip’ mentions collected from crypto social media in the past week. While the initial correction on November 15th saw the mentions soar to a 2-month high, the second pullback has yet to prompt an equally confident crowd response.
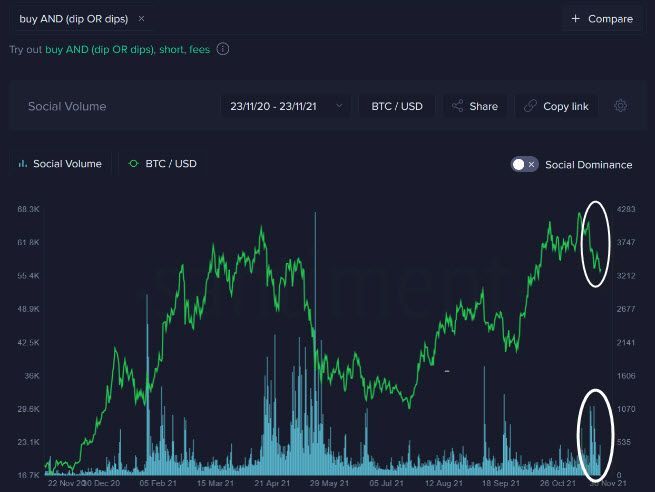
Generally, elevated positive social media mentions can be detrimental to a coin's price performance. Bullish sentiment and increased chatter can signal retail overconfidence and greed. This can push investors, mostly retail, to get into a trade late and is usually a sign of a local price top or periods of consolidation.
Therefore, the social crowd's gradual loss in confidence this week could signal oversold conditions and a good sign for Bitcoin's mid-term recovery from current support levels of $56k.
Derivatives Markets
Viewing the activity in derivatives markets can also provide insight into market sentiment.
Funding Rates
Bitcoin’s funding rate is the fee paid by one side of the perpetual contract to the other. When the funding rate is positive, it suggests a net bullish bias among derivative traders, since BTC longs are paying BTC shorts and vice versa when the funding rate is negative.
The same shift in sentiment can be observed in the derivatives markets. Funding rates were high as derivatives traders became overly confident when prices reached all-time highs. Prices have since declined gradually and funding rates have now returned to neutral levels. This suggests that derivatives traders hold a neutral outlook on Bitcoin's price action in the short-term as they are preferring to 'wait and see'.
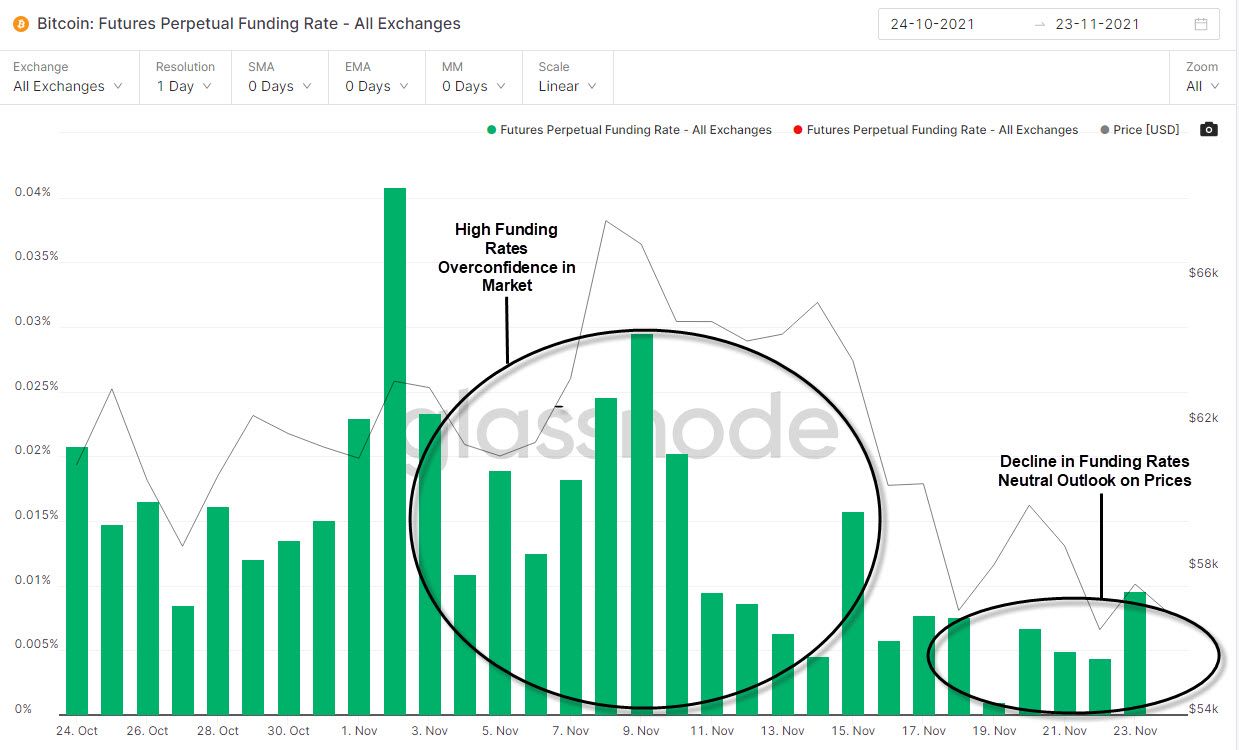
This aligns with the sentiment observed on social networks and confirms the uncertainty present in the market. Similar to social sentiment, high funding rates are signs of price tops or periods of price consolidation. Current neutral levels therefore may indicate that the current $56k level truly is a support zone.
On-Chain Fundamentals
On-chain metrics describing profitability amongst investors of Bitcoin is a good proxy for understanding buy and sell pressures in the market.
MVRV ratio (30d)
The 30d MVRV ratio tracks the average profit or loss of all addresses that have acquired Bitcoin in the previous 30 days. The ratio is at a two-month low of -7.21%, meaning that the average P/L of coins acquired in the last 30 days is -7.21%.
Usually, the higher the MVRV, the higher the risk of sell pressure. Given that the MVRV is currently at a two-month low, investors are likely to hold their unprofitable positions in hopes of a price rebound.
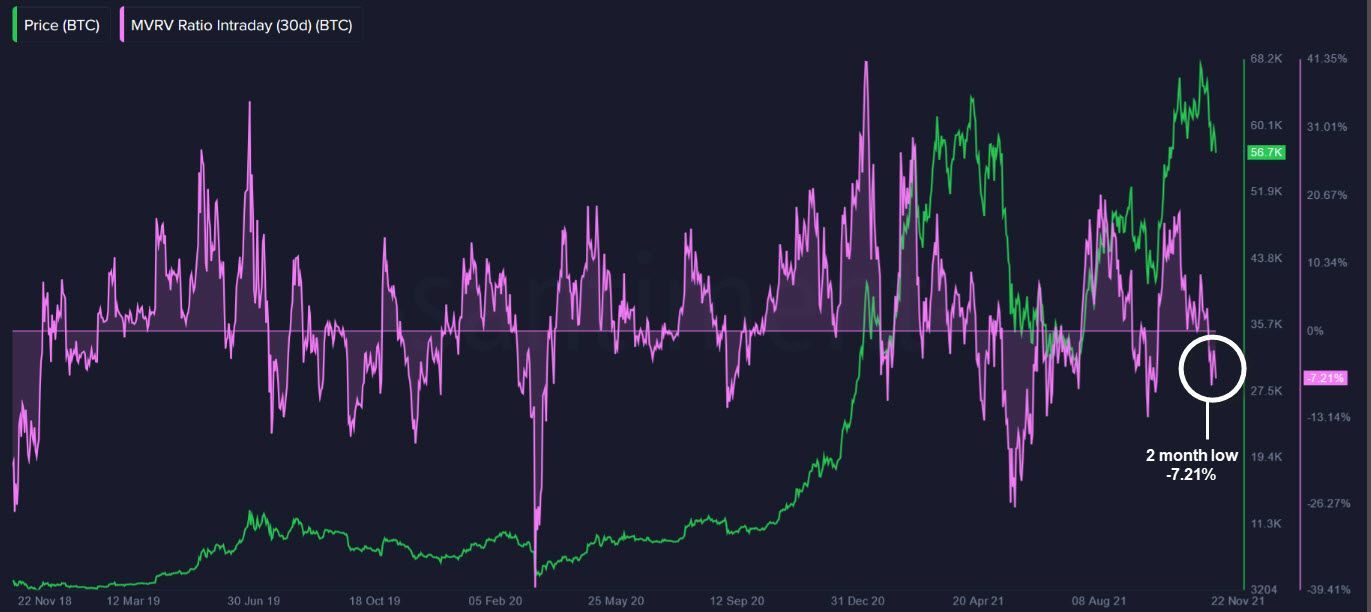
The 30d MVRV has shown tendency to bottom out at the -15% to -20% range historically, putting its current level close to the 'bottom zone'.
There is therefore still room for a further decline in price, however the ratio is at a two-month low and is close to the bottom zone. This is constructive for price and a potential price rebound in the short-term.
Note:
The reason why the 30d MVRV is used instead of the 365d MVRV is because the current market is primarily driven by short-term swing traders. The brief explanation for why is because most Bitcoins are currently held off-exchanges by long-term holders. Long-term holder spending is currently very low which means that prices are primarily driven by short-term holders. A more in depth explanation of this dynamic can be found here.
Whale Activity
Overviewing whale activity (addresses containing 100-10k BTC) is important as significant buy or sell orders from them can influence price action.
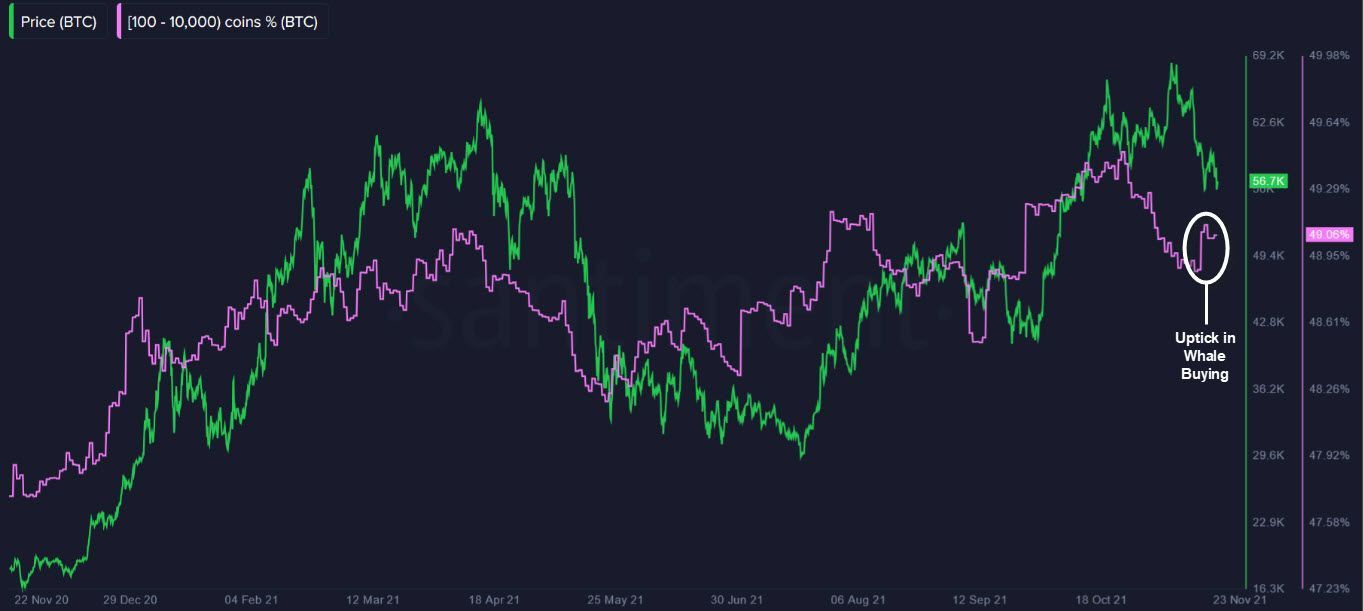
Total Supply Held By Addresses with 100 - 10'000 BTC
Whales sold off their positions significantly from October 25th - November 17th as prices fluctuated and gradually declined. This signaled a lack of confidence by wealthy Bitcoin investors in short-term market momentum.
In the last week however, we can observe the first uptick in Whale buying in a month. This could be a sign that whales are attempting to 'buy the dip' as they are looking to accumulate Bitcoins at discounted prices. Significant buy-side pressure from whales could be a potential trigger for a price reversal and rebound upwards.
Concluding thoughts
Macro Outlook
The macro picture is still bullish as the on-chain fundamentals are strong.
- Balance on Exchanges are at a yearly low
- Exchange Net Position Change is increasingly leaning toward net outflows
Short-term Outlook
Short-term corrections during bullruns are not unusual. The key is to assess the depth of the correction and when prices are due to recover.
Several factors driving Bitcoin's price, all indicate that a price reversal is expected soon:
Technical Analysis
Support level found at $56k levels.
Sentiment Analysis
Social sentiment for higher prices is low which has historically been positive for short-term prices.
Derivatives Market Analysis
Funding rates have returned from high to neutral levels, indicating uncertainty by derivatives traders. This is constructive for Bitcoin prices as the risk of of leverage long flushes is minimized.
On-Chain Fundamentals
The 30d MVRV is at a two-month low and is nearing the 'bottom zone'. Swing traders will look to hold onto their positions and wait for higher prices, mitigating the risk of further sell pressure at these price levels.
Whale Activity
Whales have started buying the dip, consolidating current support levels and creating potential upward momentum in prices.
The collection of these market factors therefore all indicate that the Bitcoin price correction is nearing its end, and that the continuation of the macro trend is due to resume soon.
