
Bitcoin:
- Price reached all-time high
- Leverage flush drops prices by 8% in a few hours
- Prices consolidated and then gradually increased due to strong supply and demand dynamics
- Bullish Macro trend
Ether:
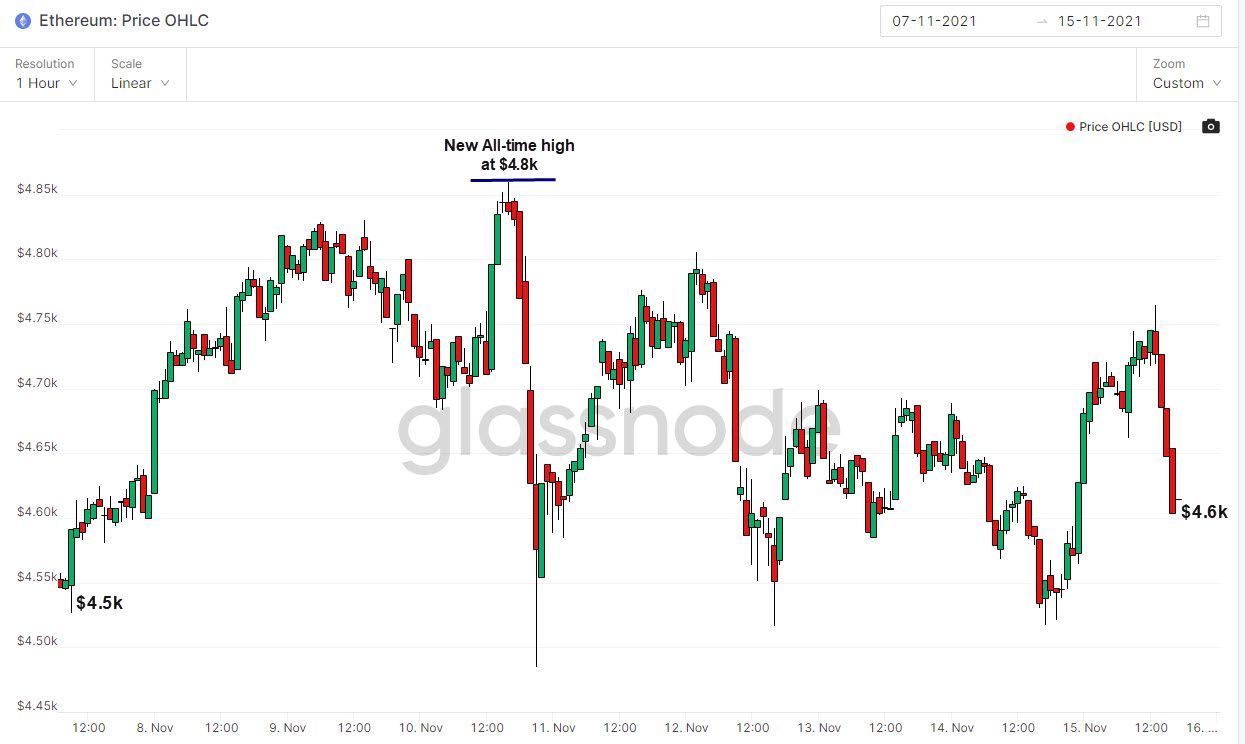
- Price reached all-time high
- Despite price fluctuations, price finished marginally higher than the start of the week
Bitcoin
Weekly Price Action
Bitcoin experienced significant movement in its price last week. Prices moved swiftly upwards to new all-time highs before retracing by 9% in a few hours before gradually consolidating in an upwards trajectory at the end of the week.
Below are the highlights of bitcoin's price action last week:
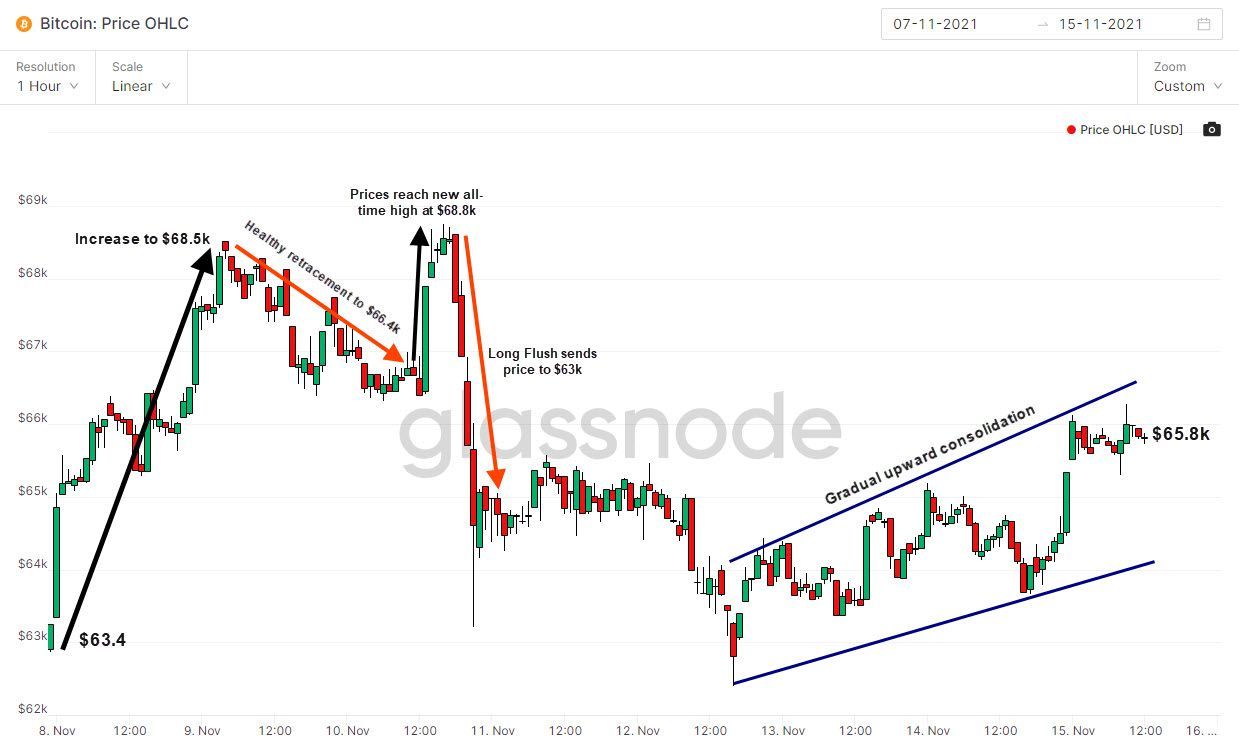
Bitcoin's price developed constructively to $68.5k on Monday November 8th, before retracing back to $66.4k on Tuesday 9th November. Prices reached new all-time highs on Wednesday 11th November at $68.8k, before retracing by more than 8% due to a leverage flush.
As prices neared all-time highs, US inflation data was released indicating that the US Consumer Price Index increased by 6.2%, the largest increase since 1990.
This coupled with uncertainty surrounding Evergrande defaults consolidated Bitcoin's image as an inflation-hedge and a 'Safe Haven' asset. This caused a large influx in open interest as investors opened long positions with excessive leverage. Prices increased too suddenly which resulted in a slight retracement. This lead to the liquidation of long positions which caused further liquidations and ultimately sent prices to $63k. In total, $536m longs got liquidated Wednesday.
Below, we can observe the drop in futures open-interest on Wednesday 11th of November, which dropped prices by 8%.
Futures Open Interest Perpetual
We can observe the gradual increase in Futures Open Interest until November 11th. Investors were overly optimistic and excessively used leverage to open long positions. A large portion of these positons were liquidated as price trickled down.
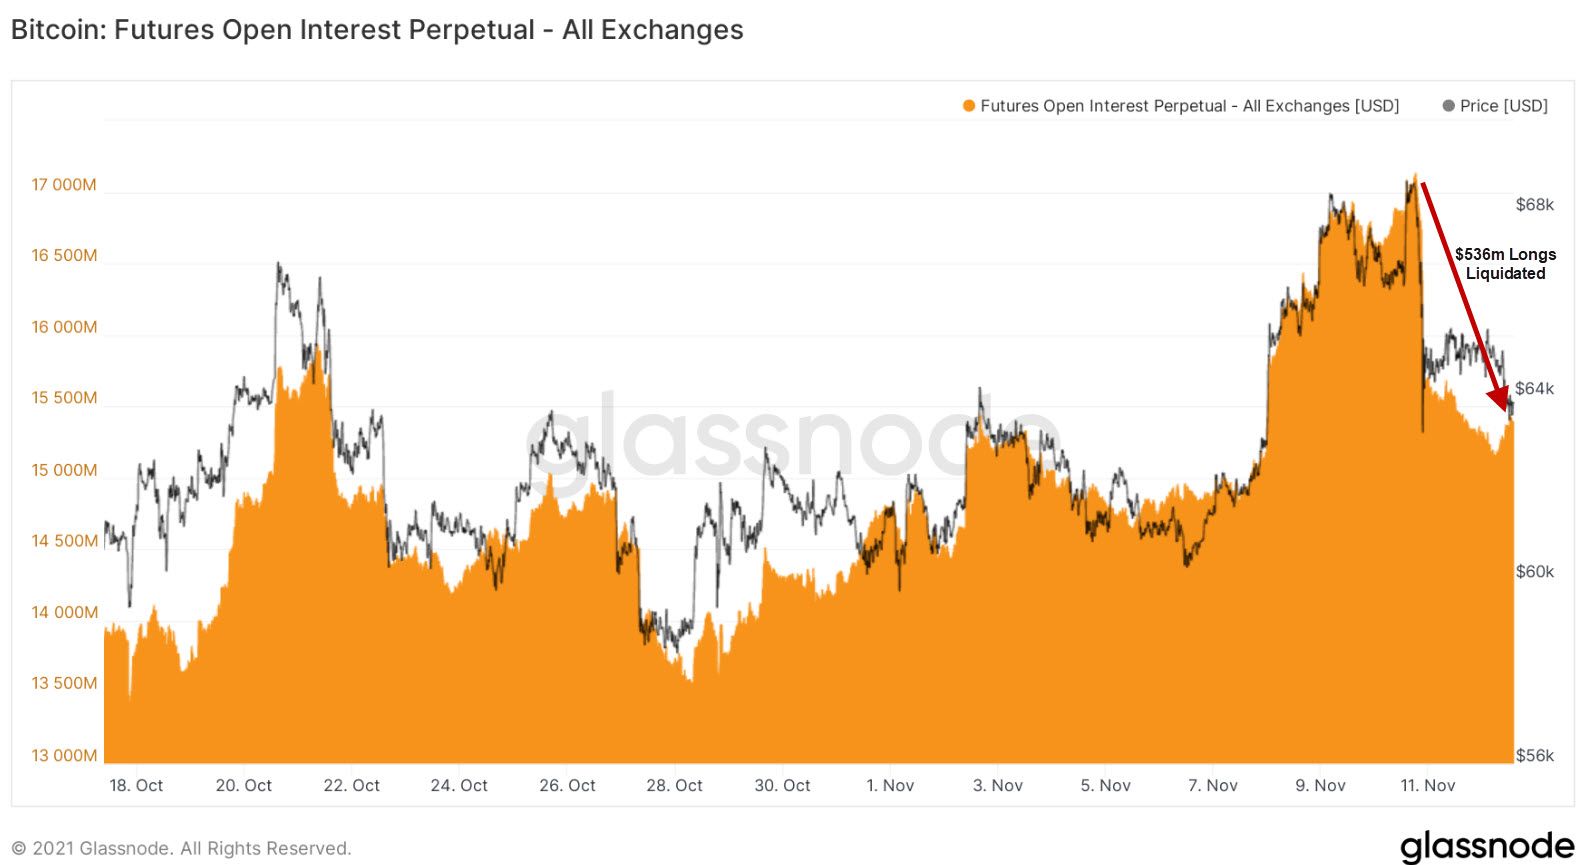
Although prices suffered an 8% drawdown in a few hours, this correction was neccesary as it eliminated overly leveraged long positions. This bull market dip cleared the way for more constructive price development for Bitcoin.
Strong Supply & Demand Dynamics
Since the leverage flush, prices have consolidated as supply and demand have balanced out. The sell pressure in the market is being met with demand, and prices have gradually climbed back to $65k.
We overview these dynamics with the following metrics:
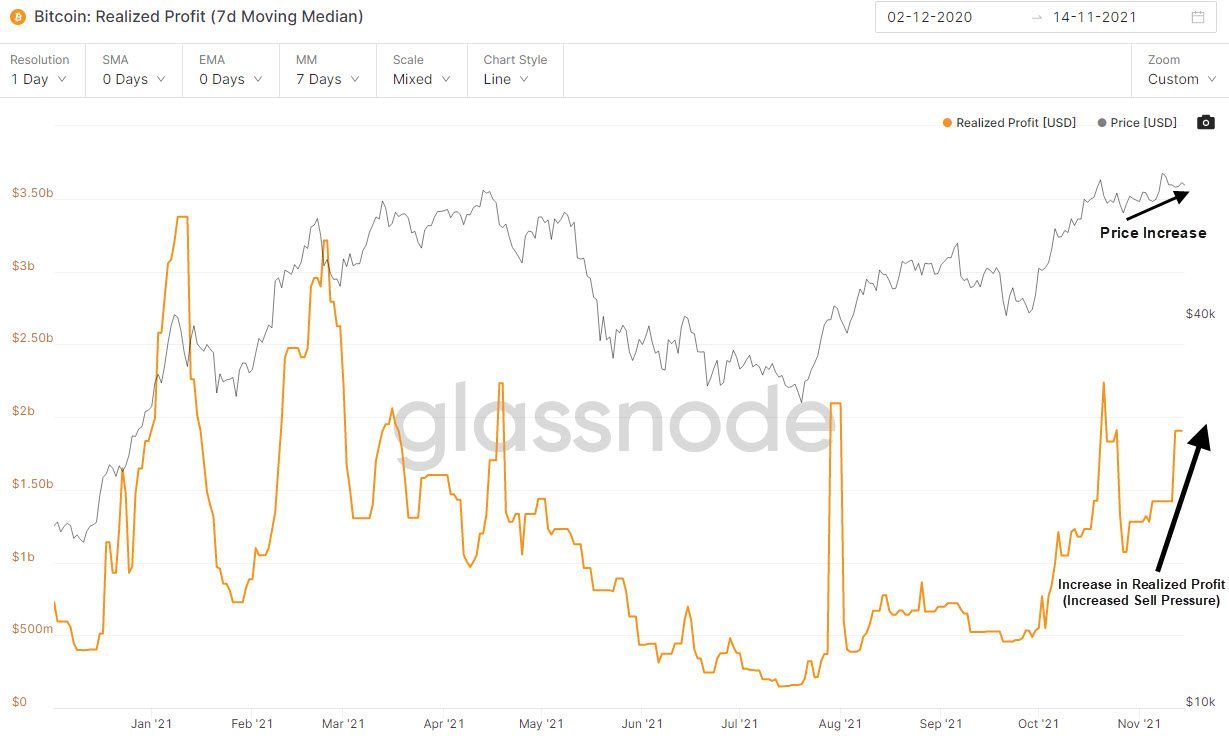
Realized Profit
Realized profit is a metric that enables us to gauge the level of sell pressure in the market. It denotes the total net profit (USD value) of all moved coins on a given day. Interestingly, we can observe an increase in realized profit in November as well as an increase in price. This means that the sell pressure caused by investors' realizing gains is outweighed by the strong demand in the market which has pushed price levels.
This is very positive for Bitcoin moving forward, as the demand in the market is strong.
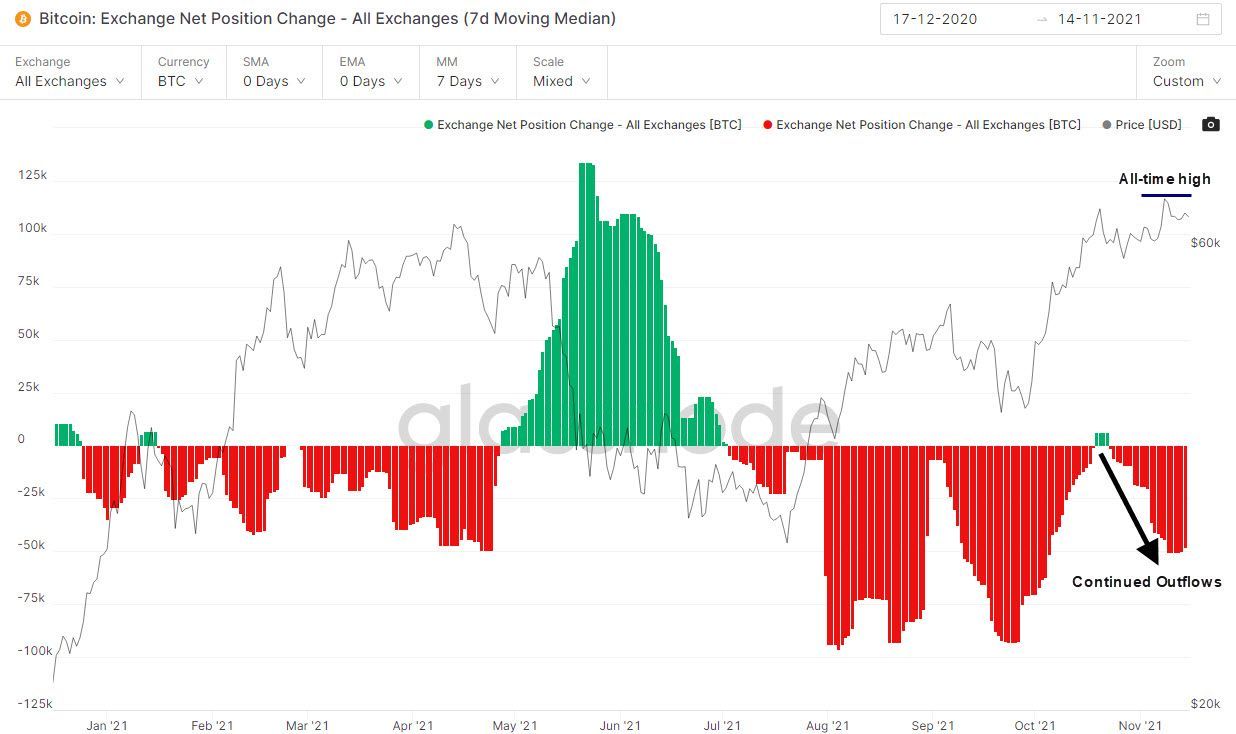
Exchange Net Position Change
The exchange net position expresses the net amount of coins that are moved onto or off exchanges. We currently observe significant outflows of Bitcoins from exchanges. This indicates that investors are keen to buy and hold their coins despite prices reaching new all-time highs. This confirms that there is strong conviction for higher prices in the market.
These coins are moved to cold storage and are not moved for an extended period of time, which tightens the supply of coins. This is very constructive for price as demand is strengthening and supply is falling.
Percentage Old / Young Coins Supply
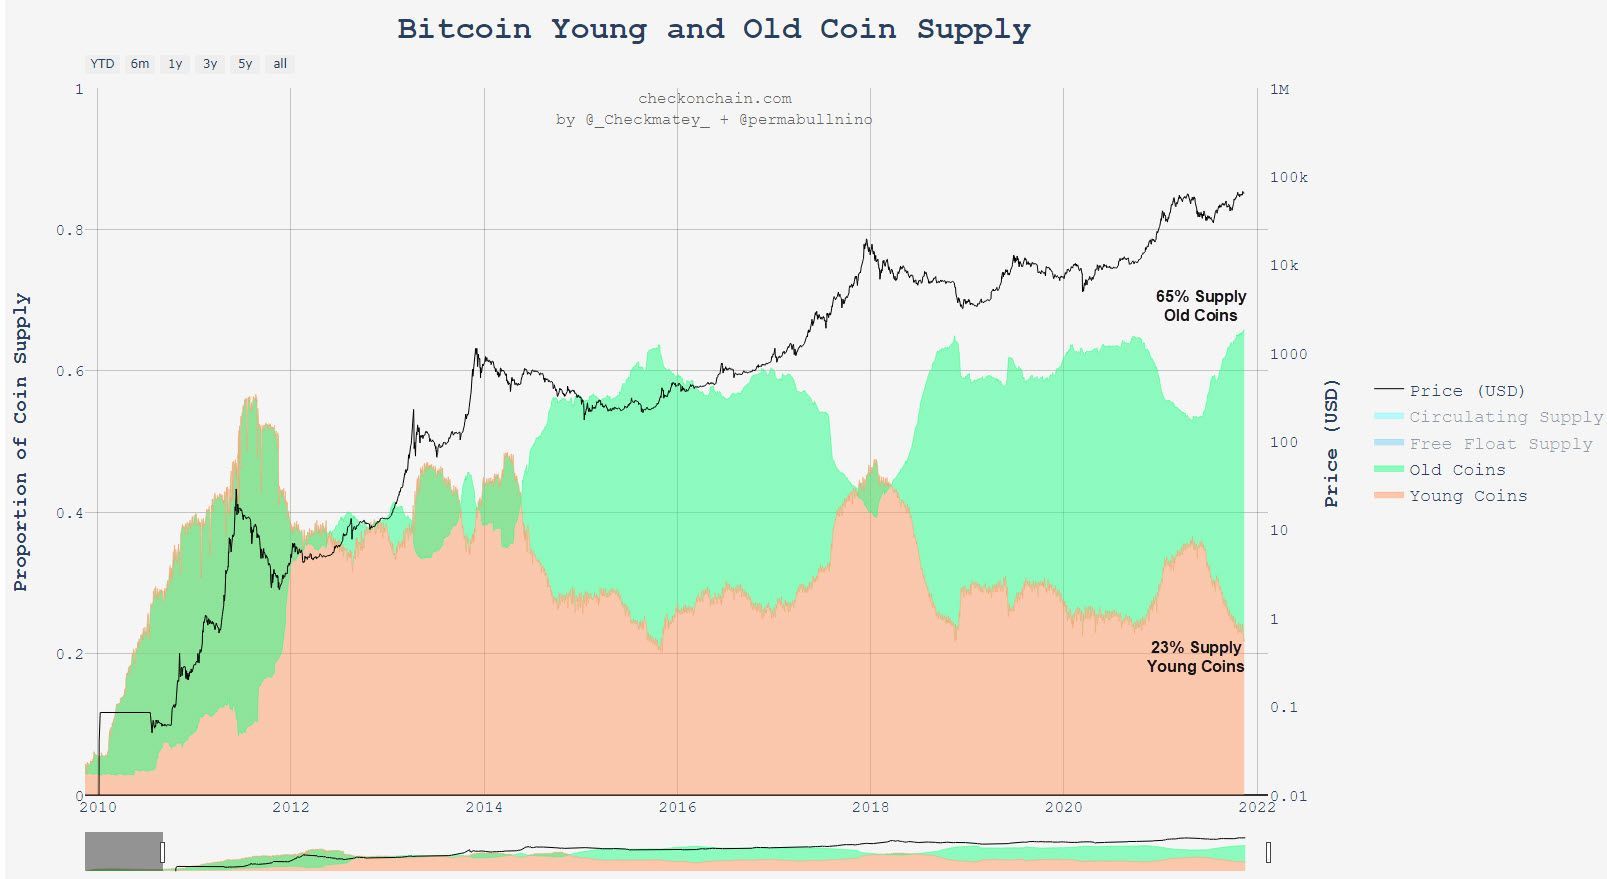
This graph illustrates the strong conviction that exists in the market. It describes the percentage of coins that are old (6 months >) and young (> 6 months).
The percentage of coins that have not moved for more than 6 months has reached a new multi-year high. Conversely, the percentage of coins that have not moved in the last 6 months is at a multi-year low. The market has historically been positioned in an early bull run, whenever such a large descrepency between old and young coins was observed.
This is because, old coins are less likely to be sold than young coins. As such, the supply of bitcoins available on exchange constricts, which tends to push prices higher until investors are satisfied with their gains and start unloading their bitcoins.
We can therefore assume that we are currently in the early stages of a bull run, and that on-chain metrics point to the possibility of a large price hike.
Concluding thoughts
The Bitcoin market experienced a signficant correction in price last week, as overly leveraged investors were flushed from their positions. This is not an abnormal occurence and will persist in the following months as investors can become overly optimistic. That is why it is important to closely track the level of open interest in the market as it is reliable indicator of potential flush outs.
On a more macro basis, Bitcoin's price is expected to continue trending upwards, as demand is favored more than supply.
This is because the market is defined by investors' willingness to hold onto their coins and restrict supply as a result. This because there is strong conviction for higher prices in the market.
The slight sell pressure is met with demand in the market. Although slight corrections such as last week's leverage flush are normal and expected to occur again, the overall trend in the market is bullish.
Ether
Weekly Price action
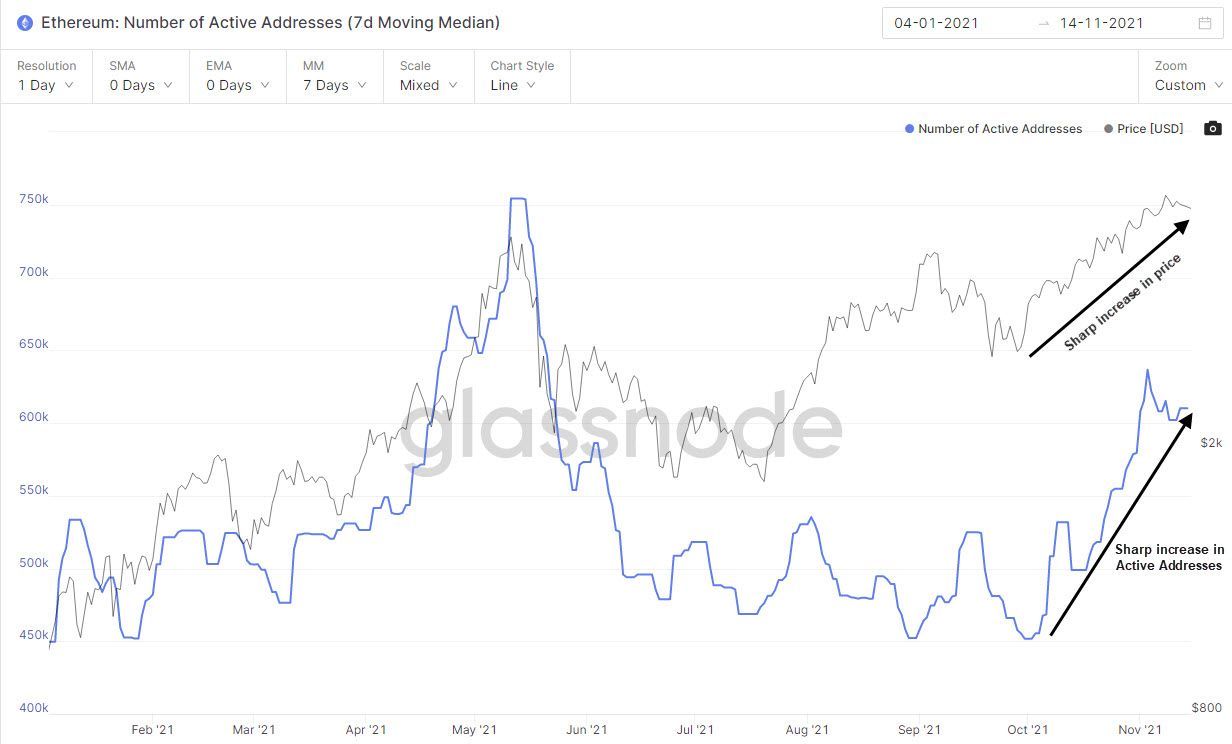
Number of Active Addresses
This metric illustrates the number of unique addresses that were active either as a sender or a receiver on the Ethereum blockchain. We can observe that active addresses have shot up since November, after a period of stagnation since the July price lows. The network's participants are increasing which translates into more value being transferred on the network.
This increase in network activity has coincided with an increase in price. That is logical as more value is tranferred on the network which inherently pushes the value of Ether higher.
Total Value Locked in DeFi
The Ethereum blockchain is host to many protocols that provide 'Decentralized Finance' (DeFi) services. These protocols offer a variety of services such as the possibility to add tokens to a liquidity to pool to facilitate the lending & borrowing of a token, which is also know as 'staking'. Total value locked therefore infers the amount of value locked in DeFi protocols on the Ethereum network.
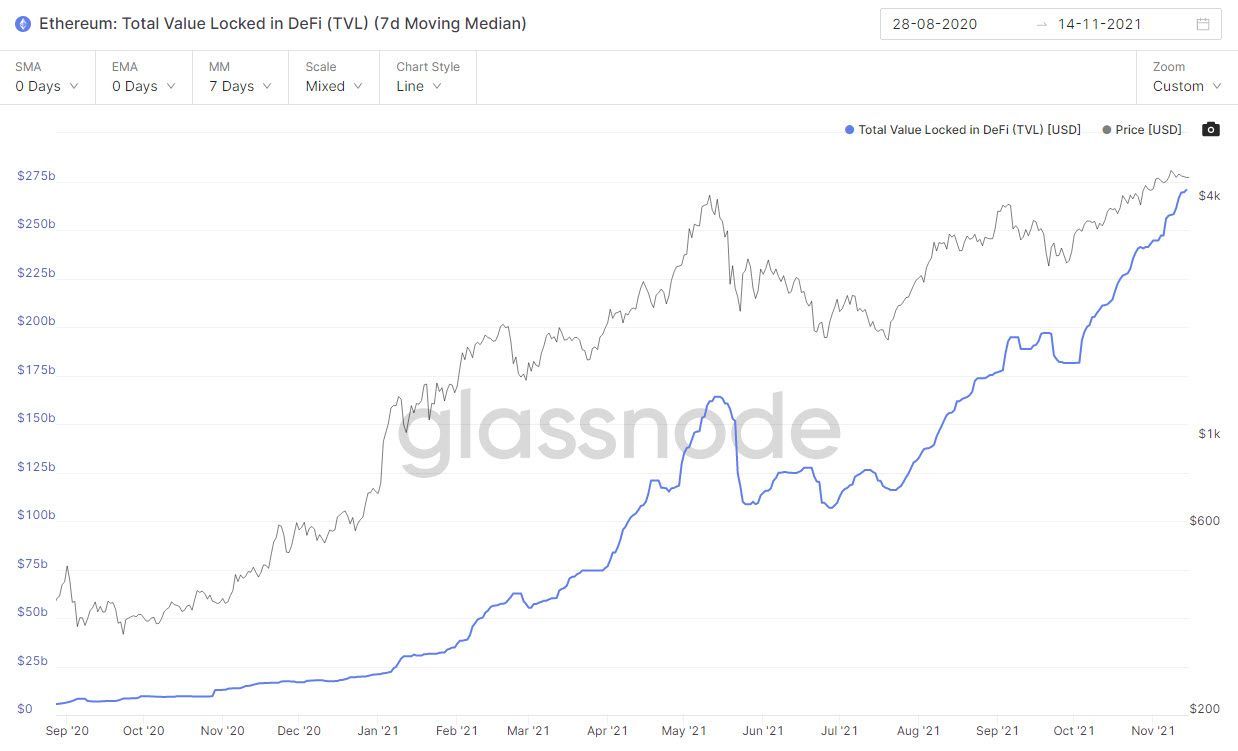
The Ethereum blockchain has been able to amass a large amount of value into DeFi protocols that run on their network. Since the July price lows, the metric has continiously trended higher and is currently at an all-time high. Although this money isn't directly invested into Ether, the fees incurred in order to use DeFi services are paid in Ether. The trend upwards is therefore very constructive for Ether prices moving forward.
MVRV Z-Score
The MVRV Z-Score is used to assess when Bitcoin is over/undervalued relative to its "fair value". It derives a ratio between the market capitalization and realized cap (price at which a coin last moved) which is then divided by the standard deviation of the market capitalization.
The higher the MVRV Z-Score, the more overvalued Ether is.
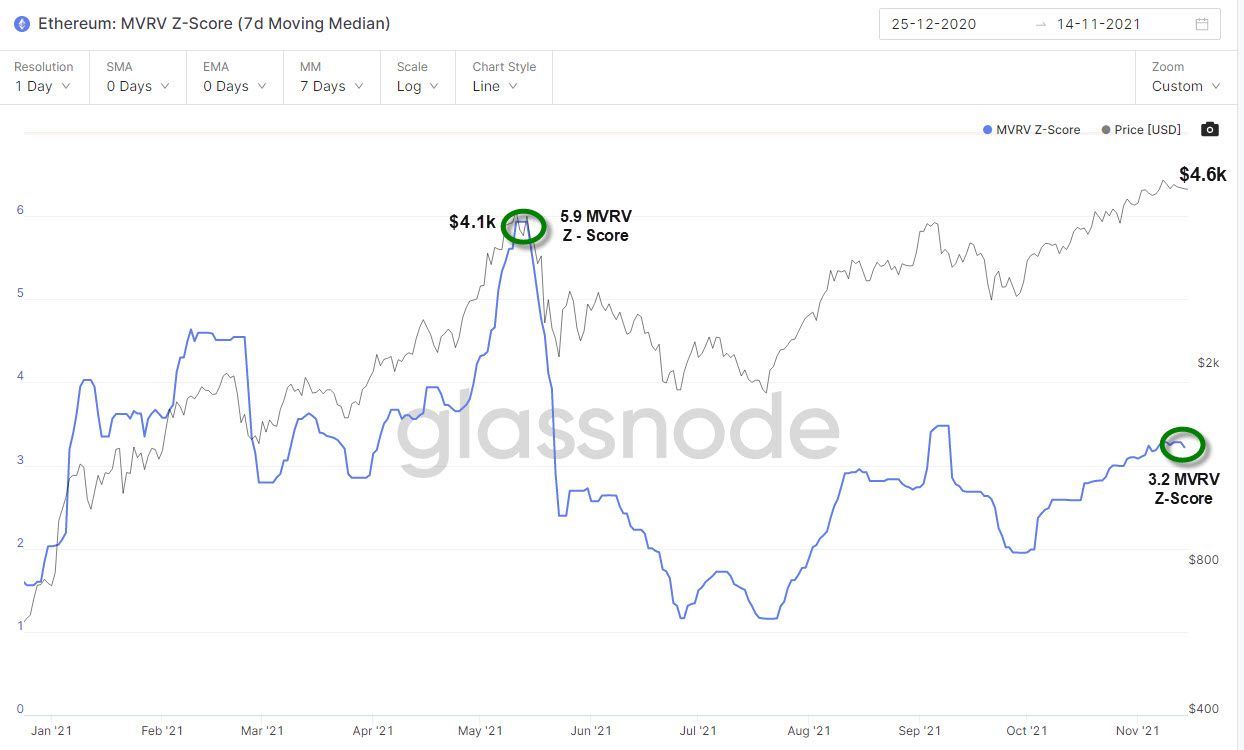
The last time we were at these price levels, Ether was overvalued as the MVRV Z-Score was relatively high at 5.9. As such, price fell and only recovered months later. We currently sit above the all-time highs set in May, yet the MVRV Z-Score is at 3.2 which is significantly lower than what it was in May. This suggests that Ether is currently not as overvalued as it was the last time it was at these price levels and therefore has room to push higher.
Concluding thoughts
Ether has slightly increased over the last week, partially due to Bitcoin's large retracement. The on-chain metrics however, still paint a bullish macro picture as the network is locking an increasing amount of value as well as attracting more users. Lastly, the MVRV Z-Score ratio indicates that Ether is undervalued relatively to past prices, which consolidates the upward trend the coin has been on since its July price lows.
