Ethereum Long Term Chart
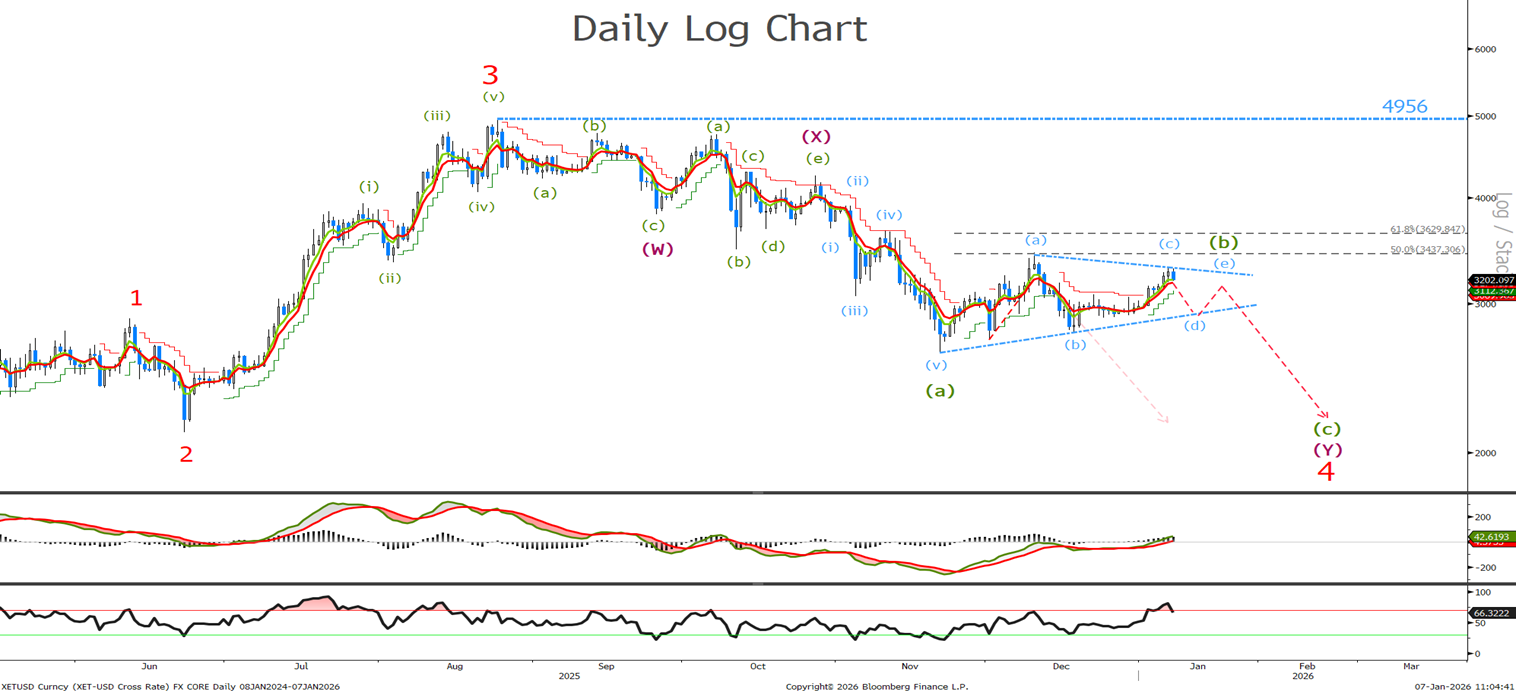
Last time I said ‘it appears we are tracing out a corrective triangle that should turn from below 3450 with confirmation that wave C is underway on a break below 2774. A move above 3450 will target 3629 and we would sell there with stops remaining at 3827.’ No change in our long term view. Lets look to the short term to see where in wave (d) we are.
Ethereum Short Term Chart
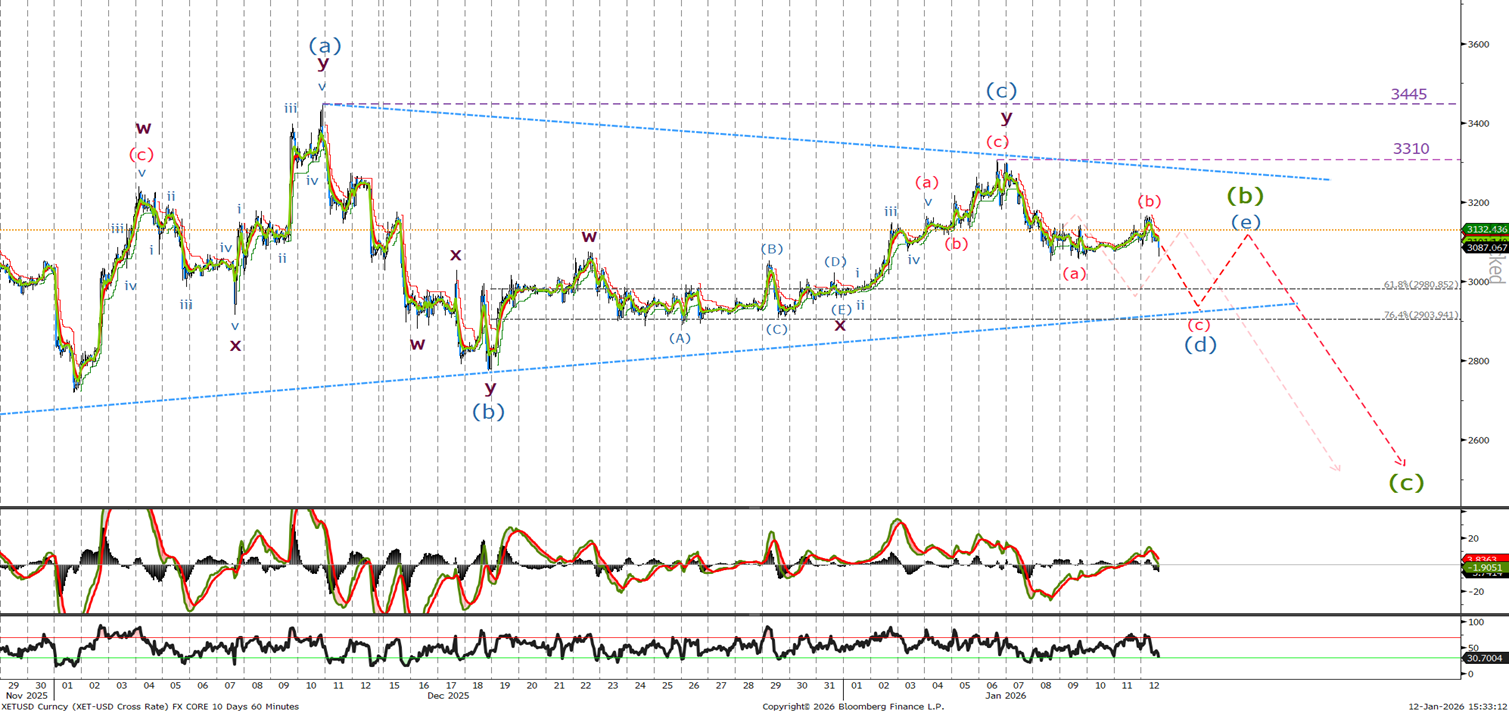
Last time I said ‘its appears we are tracing out a triangle , if not short sell now at 3106 and lower stop loss levels above the wave (a) at 3450. Trading above 3700 will necessitate a change in the view and could signal the bullish trend has resumed.’ We are trading at roughly the same levels as the last update and it appears to me we should see a sell off in the short term to complete wave (d). I am happy to sell here at 3080 with stops at 3310 or 3445.