Ethereum long Term Chart
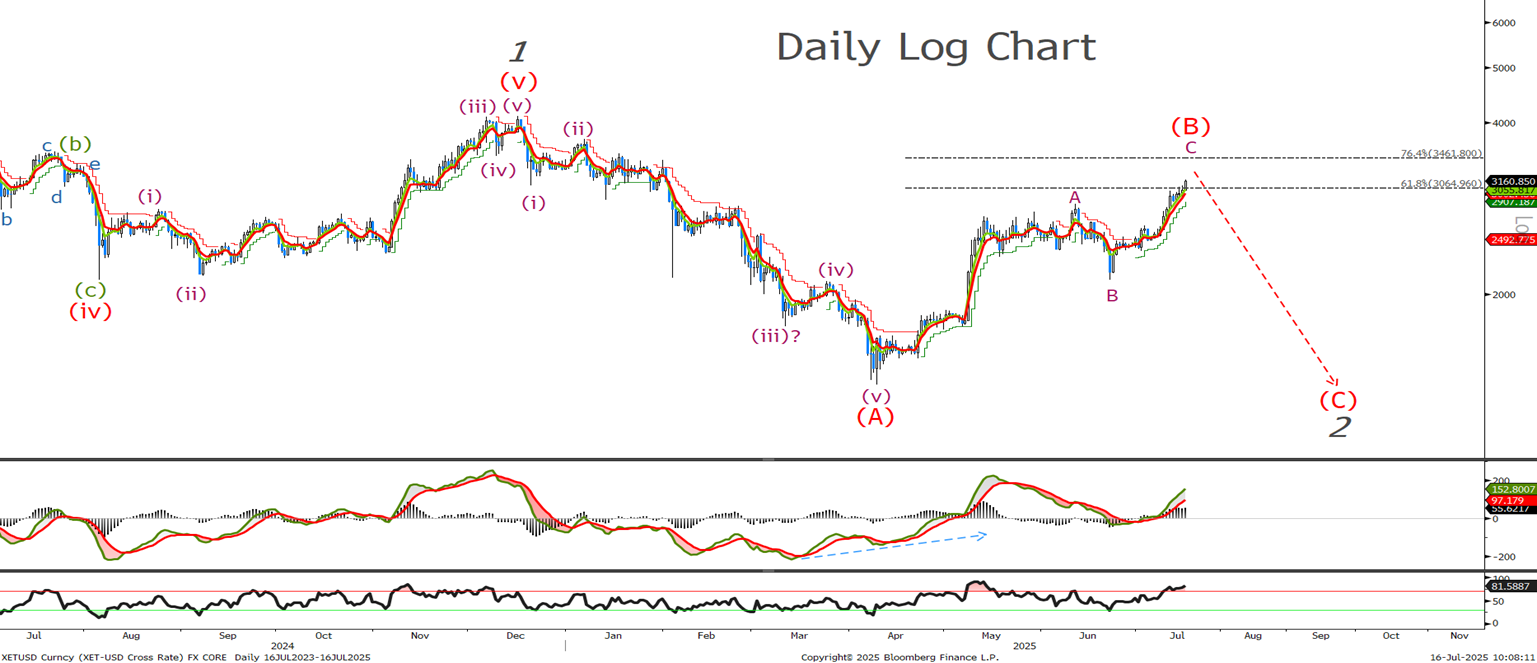
We were looking for lower with stops above 2900 or 3100 , this morning we broke the 3100 level and it appears that we are approaching extreme levels in a wave (B) correction which should end around the 61.8% or 76.4% area . A daily close below 2820 will be the first signal that wave © lower is underway. Despite expecting lower whilst below the below the 4120 high lets look to the short term chart to see where we are in the price cycle.
Ethereum 60 minute Chart
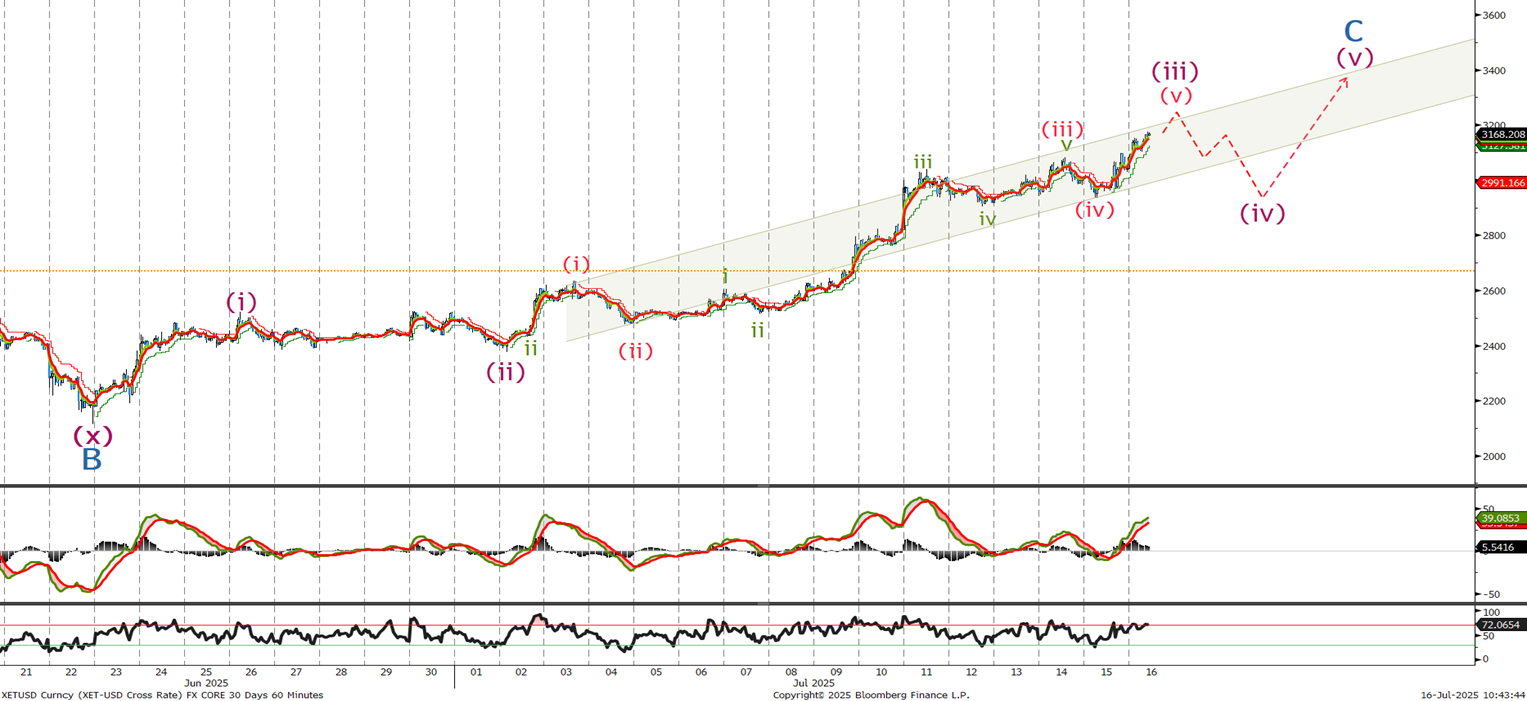
Looking at the hourly chart we are looking for wave (v) of (iii) to complete before a correction towards the 3000 level in a larger correction. This will enable us to rebuy lower. It is possible that we completed today if so there should be good buy levels around the 2880 or 2770 levels. This should be followed by a test of the 76.4% retracement level at 3460.