Ethereum Long Term Chart
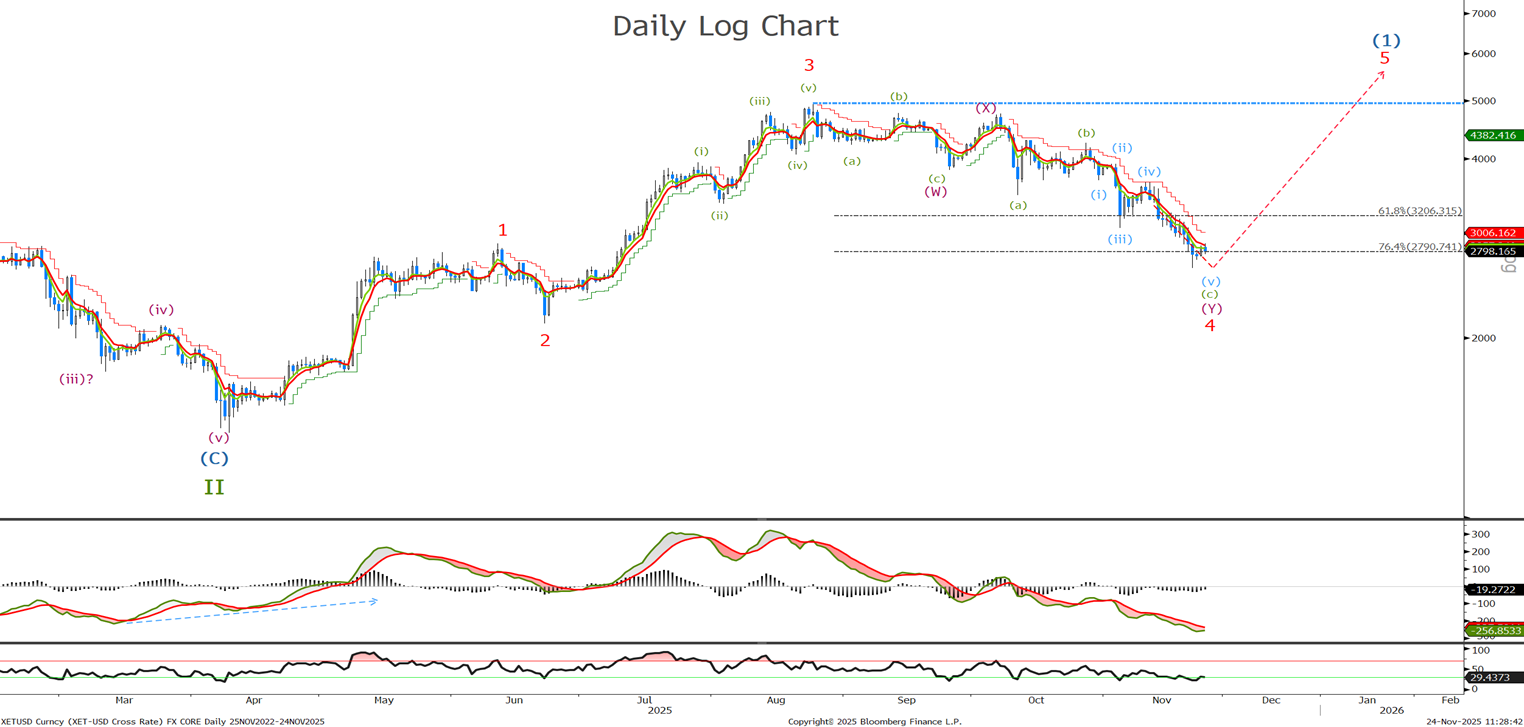
Still no change in the view ‘The ETH fell inline with expectations as we approach the 76.4% retarcement level at 2785. There is no sign of divergence in the daily but lets look to the short term chart to see if there are any clues there as it appears wave (c) may have completed in 5 waves.
Ethereum Short Term Chart
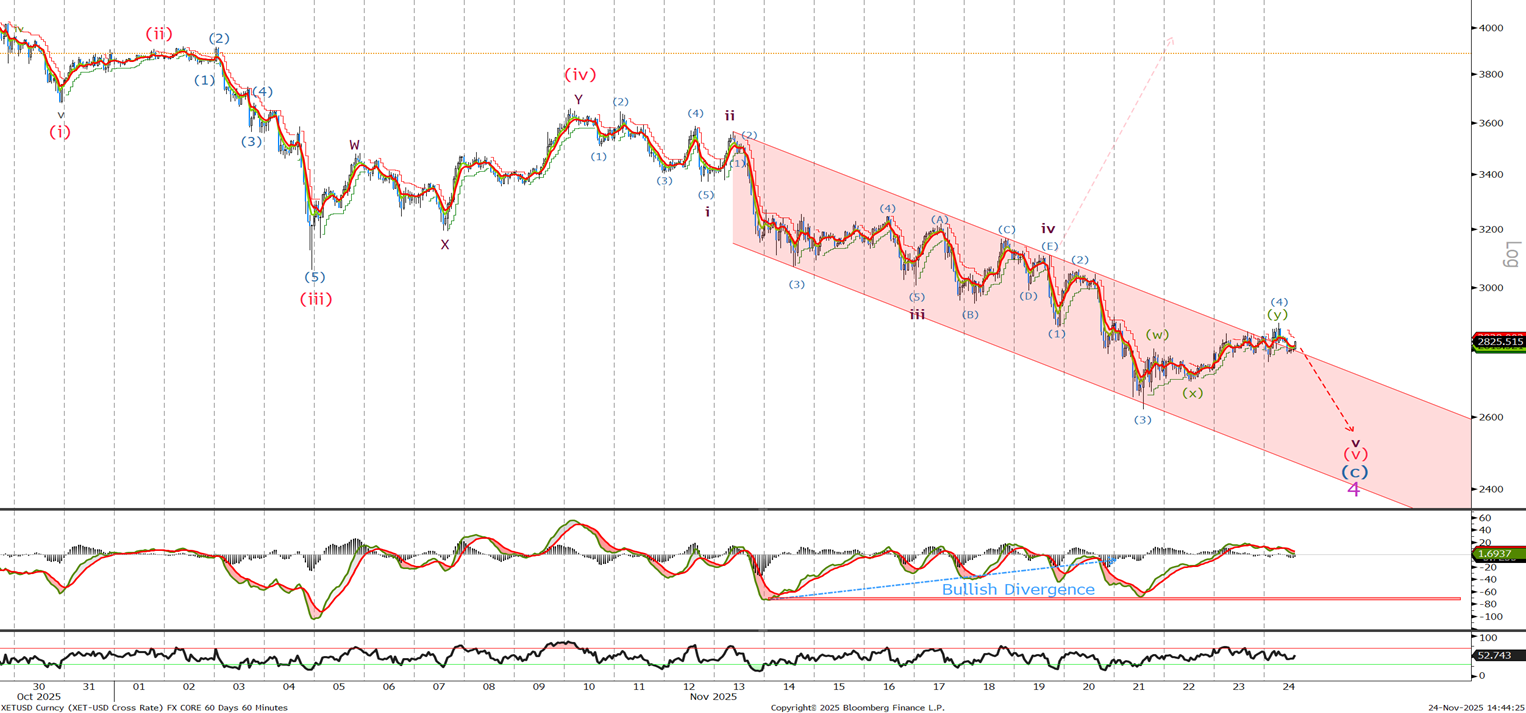
Last time I said ‘I would rather not fight the trend and buy on a stop entry above 3265 with stops placed below whatever is the current low. This stands at 2946 unless we break and test the bottom of the channel in a longer wave v towards the 2600 level. Hence I would rather wait until momentum has turned in the bullish favour.’ That was almost a perfect view never trading higher before selling off and reaching a low of 2621 before correcting over the last few days. This looks to me like a wave (4) and we should see one final push below 2600 to complete 5 waves and present a great buying opportunity towards the 2500 level.