BTC
Close to completing a corrective triangle with a likely breakout of the triangle to the upside with confirmation above $42k. A $10k move higher is in play on the long-term chart.
ETH
Expected to stay above $2'446 and move a leg higher, similarly to the BTC chart.
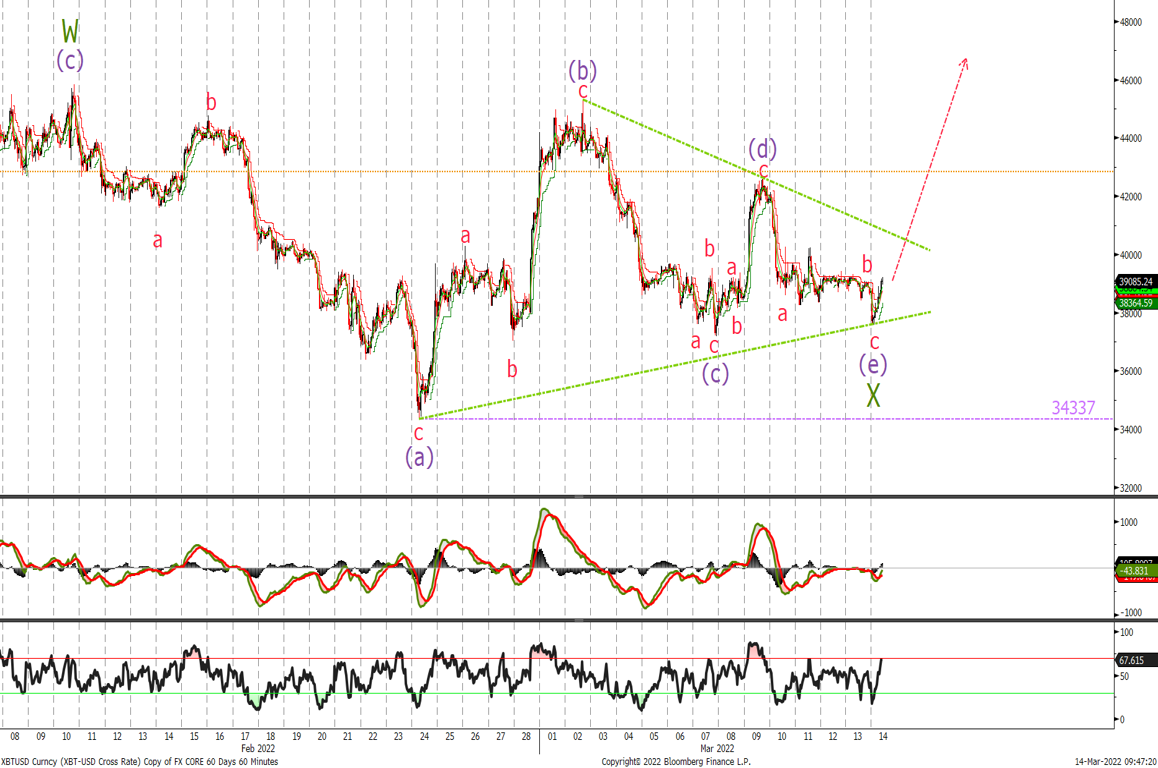
Bitcoin Short-Term Chart
Last time we said:
‘I think we may still test the $37k level. We would remain long or look to buy around that level with stops now below $34'337. A move above $39'200 will be the first indication that wave ii has ended along with a 5 wave advance above $40'000. A break below would likely put last week's longer term zigzag correction into play’
We traded down to $37'174 before rallying to $42'851. The subsequent sell-off though appears corrective and whilst above $34'337 it appears that we have completed (or are close to completing) a corrective triangle that calls for a move higher. A breakout of the triangle followed by a close above the wave (d) last week's high will confirm the next leg up is underway.
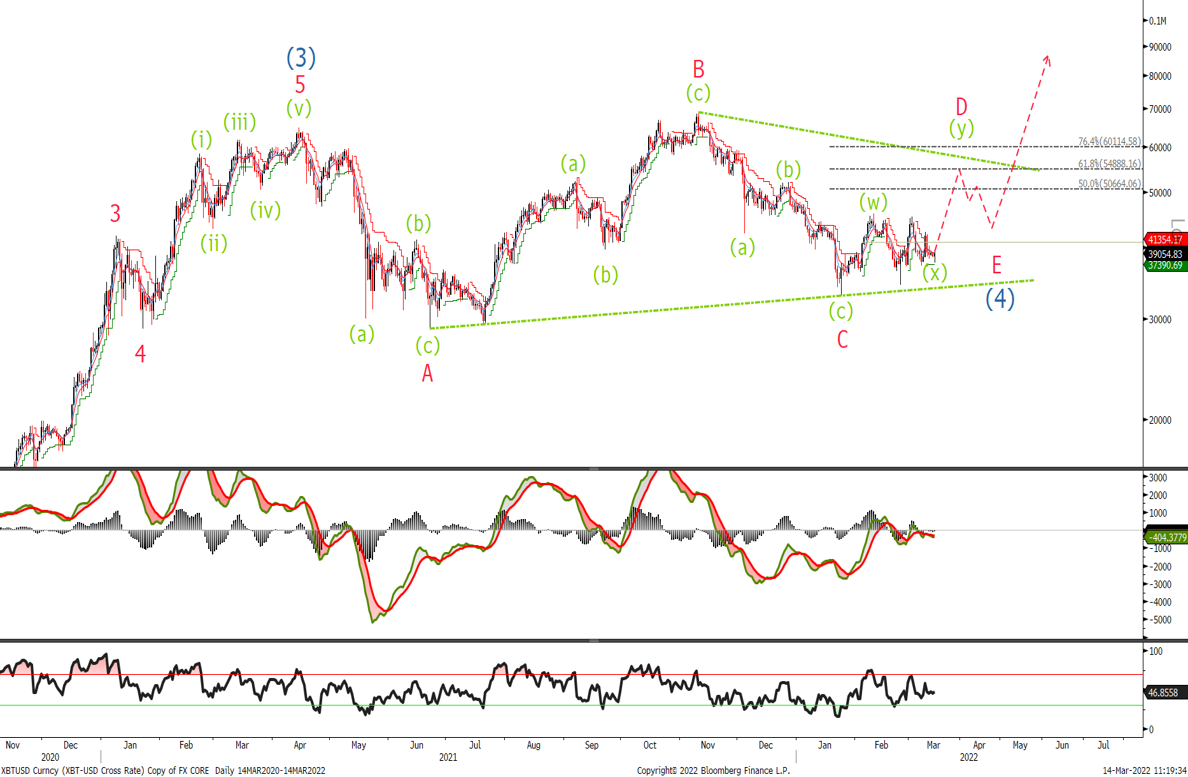
Bitcoin Long-Term Chart (Logarithmic)
I am showing the long term BTC chart on a logarithmic basis in order to see where I believe we are trading long if we remain above $28'824. I expect to see a push higher towards the $54'888 level.
I would use any pullback from that level to buy with stops at $32k, but we will examine that when it happens. In the meantime some of the indicators I look at are signalling that a turn is imminent and we should see at least a $10k move higher soon.
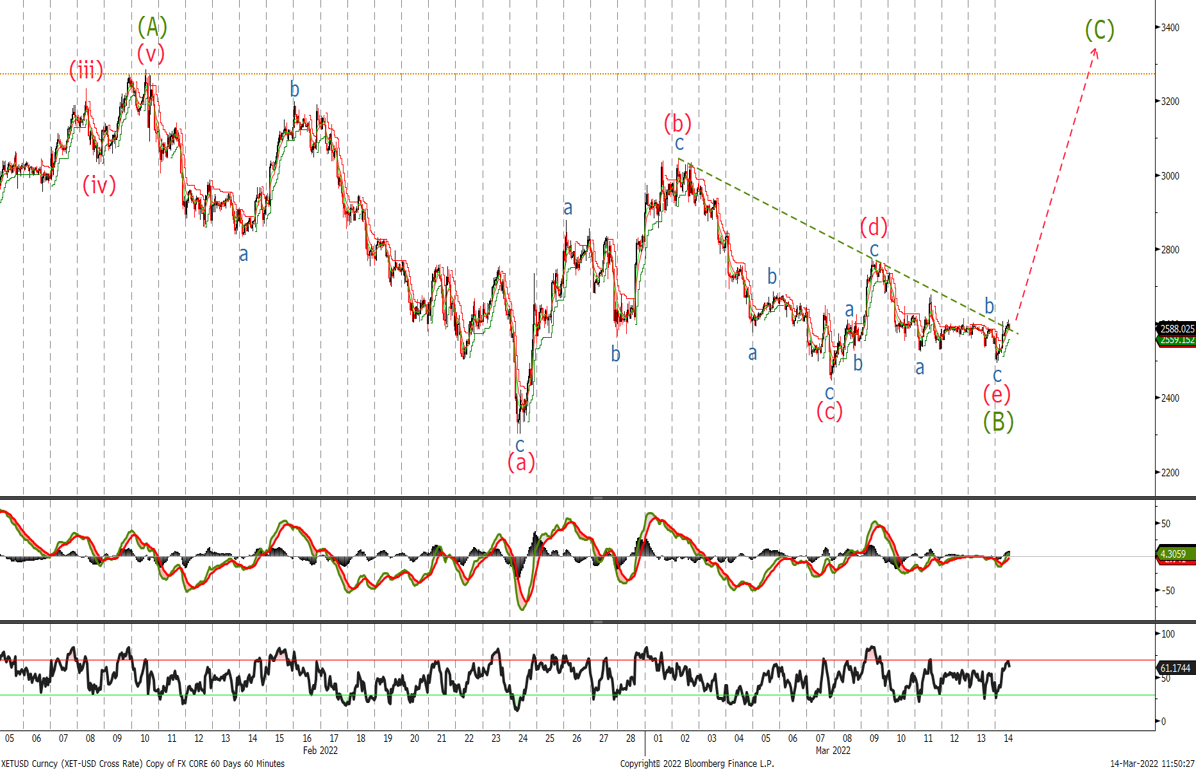
Ether Bullish Chart
We said last week:
‘I would look to buy now with stops remaining at $2'300 level. A move back above $2'658 would be the end of wave (4) and the first indication that a low is in place. With a close above $2'690 confirming. Remain long and add on a move above $2'690 raising stops to the most recent low. A break of $2'300 puts the larger correction discussed 2 weeks ago into play’
We traded to $2'771 before selling off to the overnight low at $2'493. We should stay above last week's low at $2'446 now, place stops there or rather leave at $2'300. Looking for an acceleration to the topside to get underway with the longer term ETH showing a similar pattern to the previous BTC chart.