Bitcoin Weekly Chart
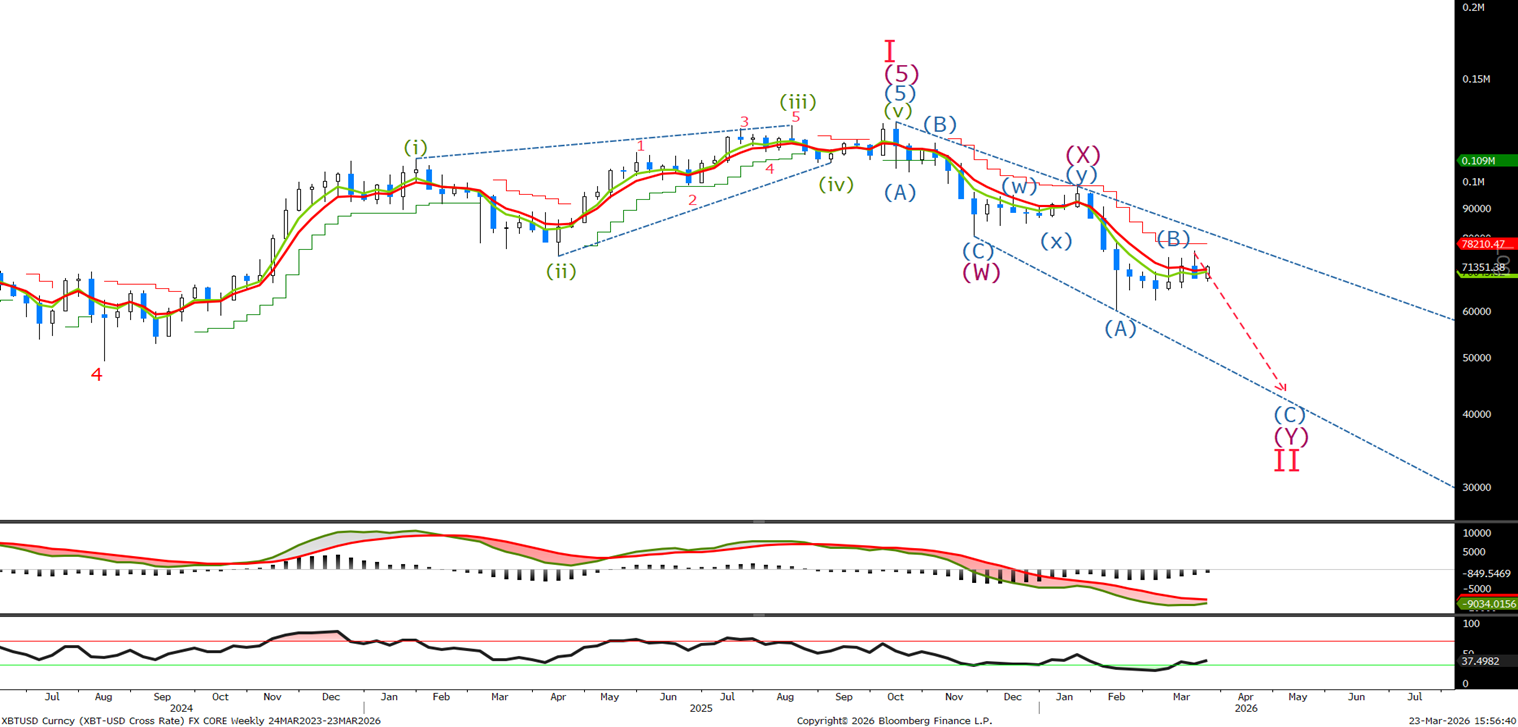
Last time I said ‘No change in the Weekly view as we continue to wait for wave (B) to end before the next leg lower. I believe it has, I will show why on the short term charts’. We continue to look for lower , lets look to the shorter term to see how far along wave (C) we are.
Bitcoin Daily Chart
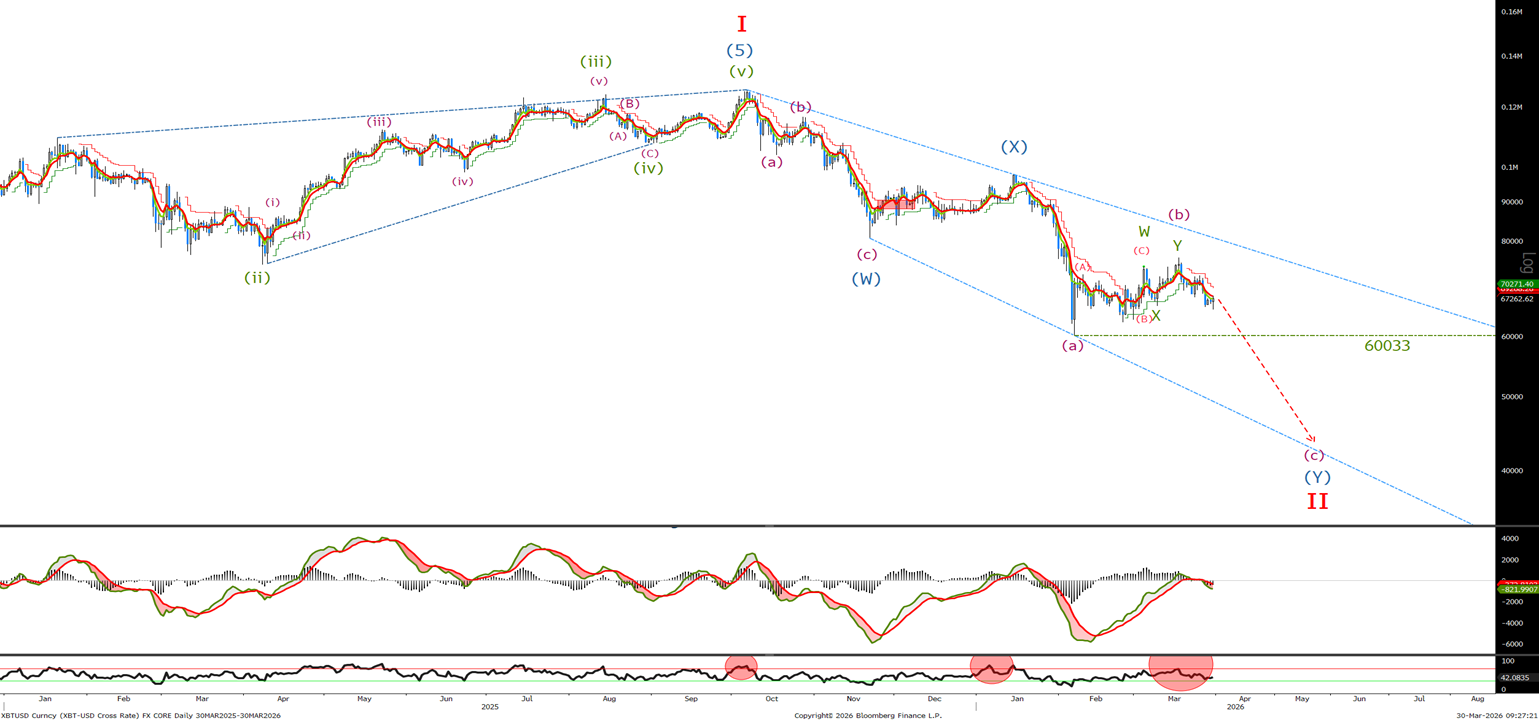
The daily chart shows the slight new high for wave Y completed wave (b), and we should now sell off in 5 waves to complete the larger wave II correction. Expect an acceleration on a break below the wave (a) low at 60033.
Bitcoin Short Term Chart
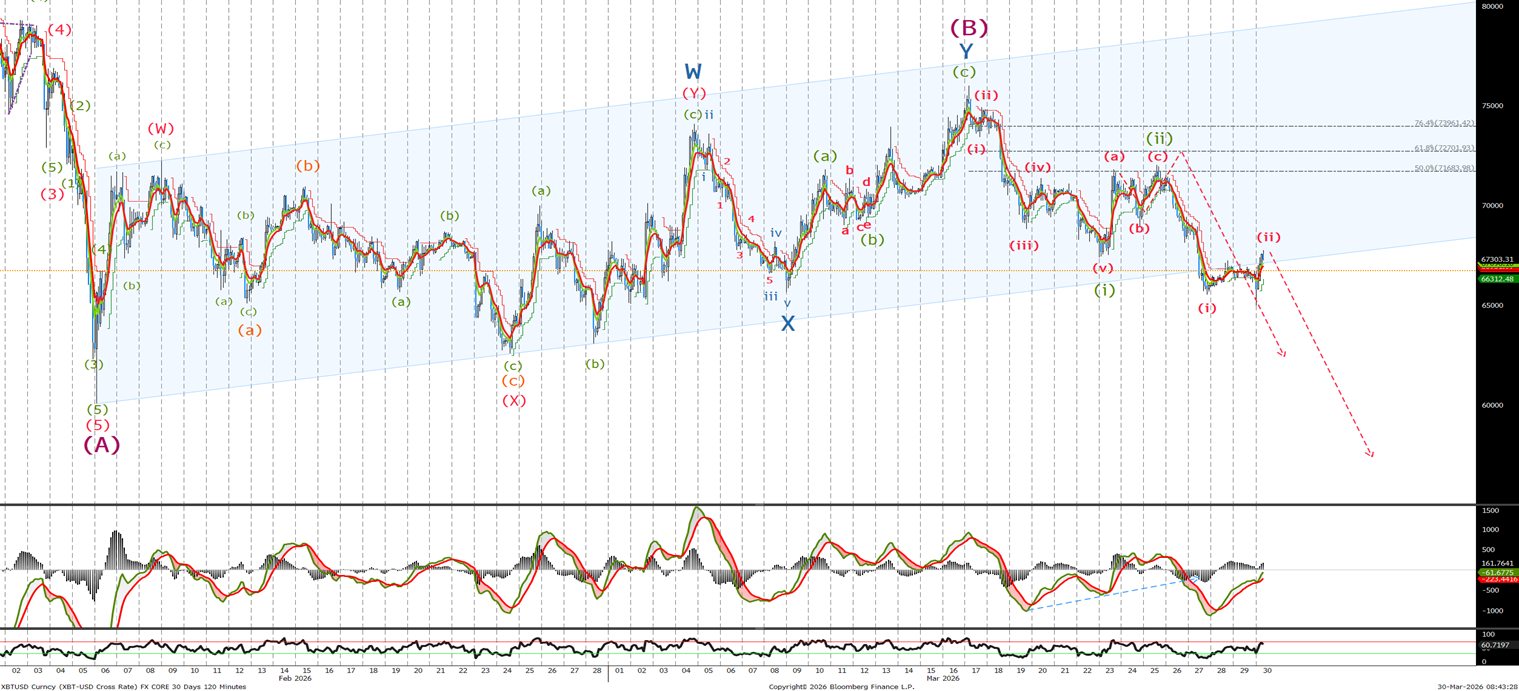
Last time we said ‘The high was 75997 before selling off in 5 waves to what I am calling wave (i) I believe we are correcting in3 waves and will look to sell at 72.5 and 74K level with stops above last week's high for a push below 66000.’ We traded to 72013 just shy of our target before selling off and breaking the channel to complete wave (i) , we have since corrected in 3 wave to complete wave (ii) and I expect to see a sharp sell off any time now to below 60033.
Bitcoin 30 Minute Chart
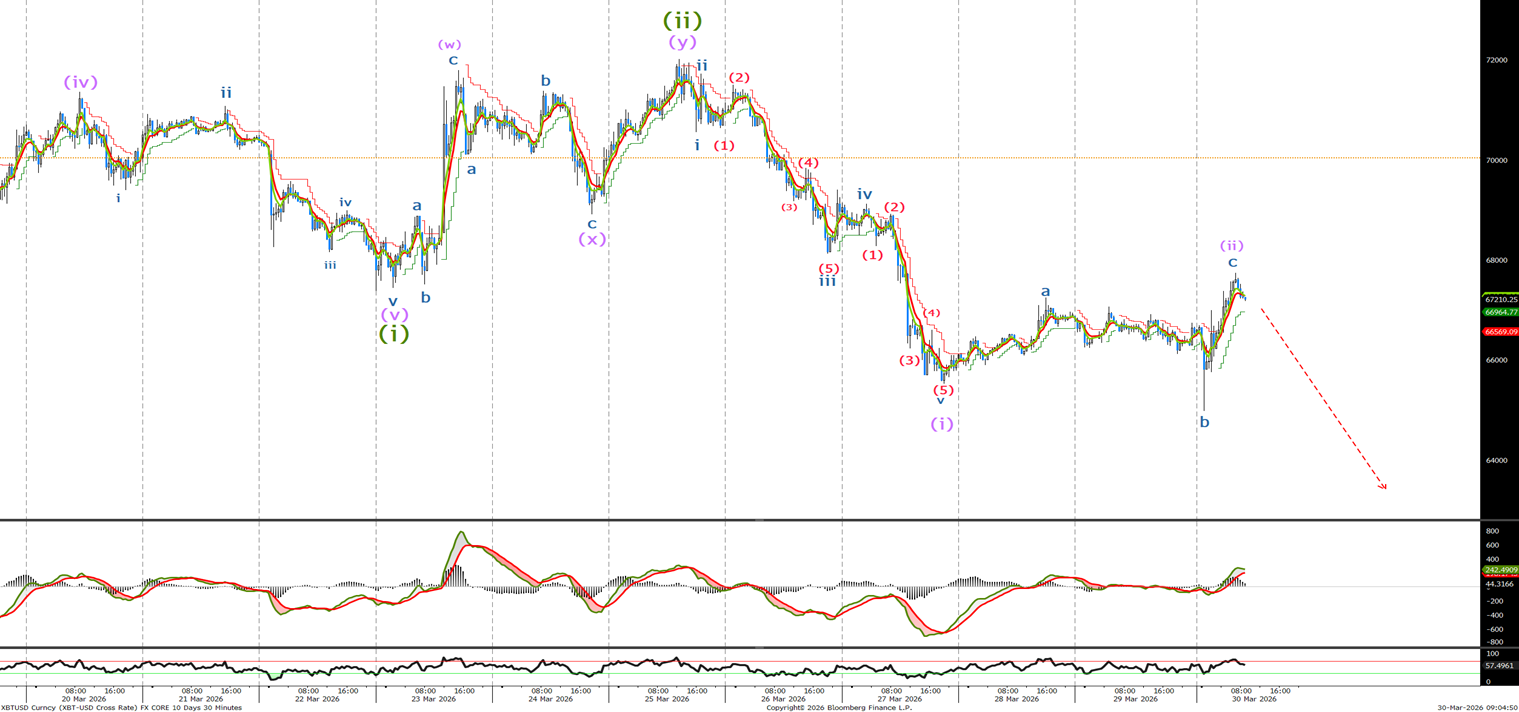
If we break the BTC into the 30 minute chart you can clearly see the short term price movements. If wave (ii) hasn’t ended then look to sell at 68002 and again at 68768 with stops now at 72020.
Ethereum Long Term Chart
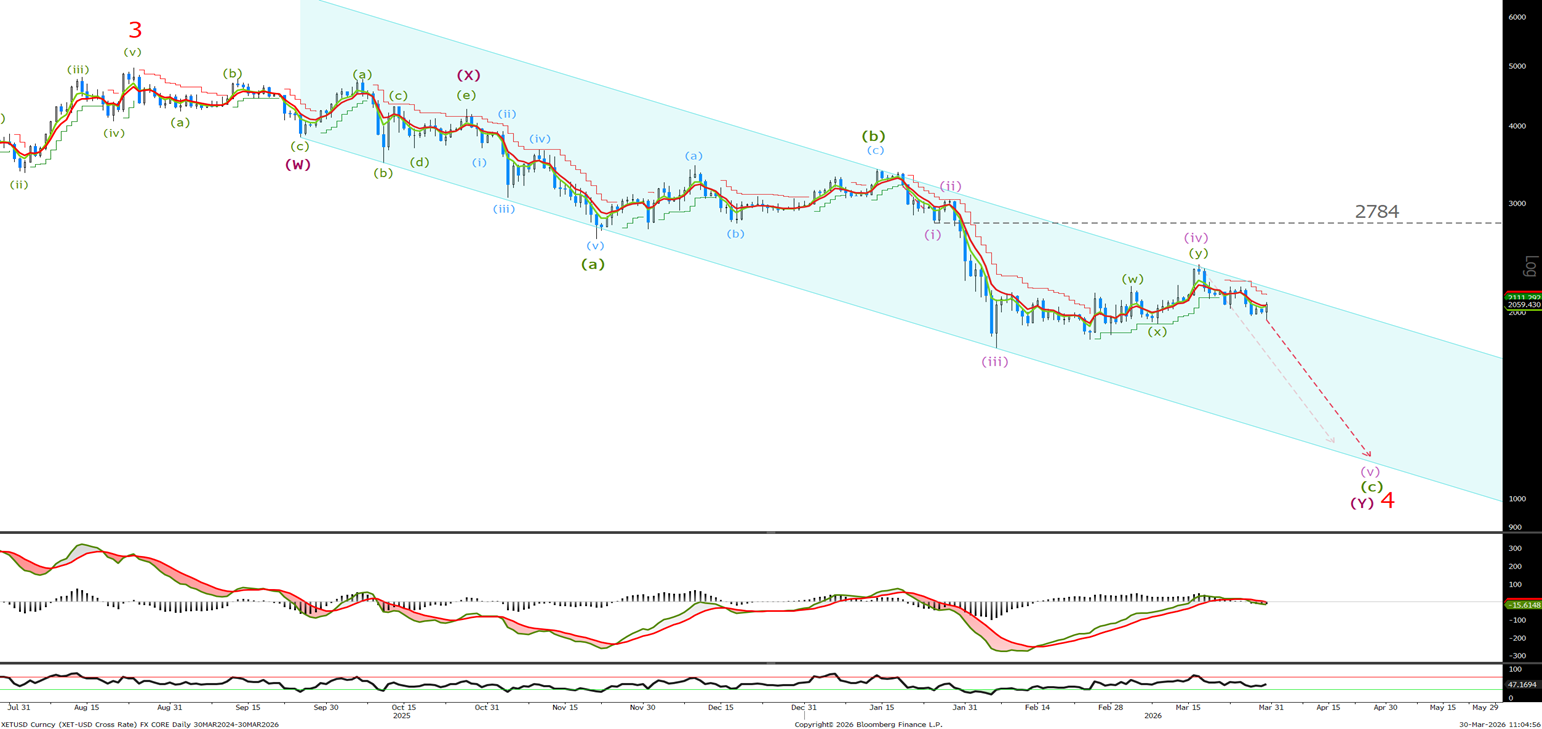
Last week I said ‘We tested the top of the channel and sold off inline with expectations. Let's look for confirmation of a 5 wave sell off in the short term.’ Nothing has changed as we continue to look for lower in the ETH. Expect an acceleration lower on a break of 1746.
Ethereum Short Term Chart
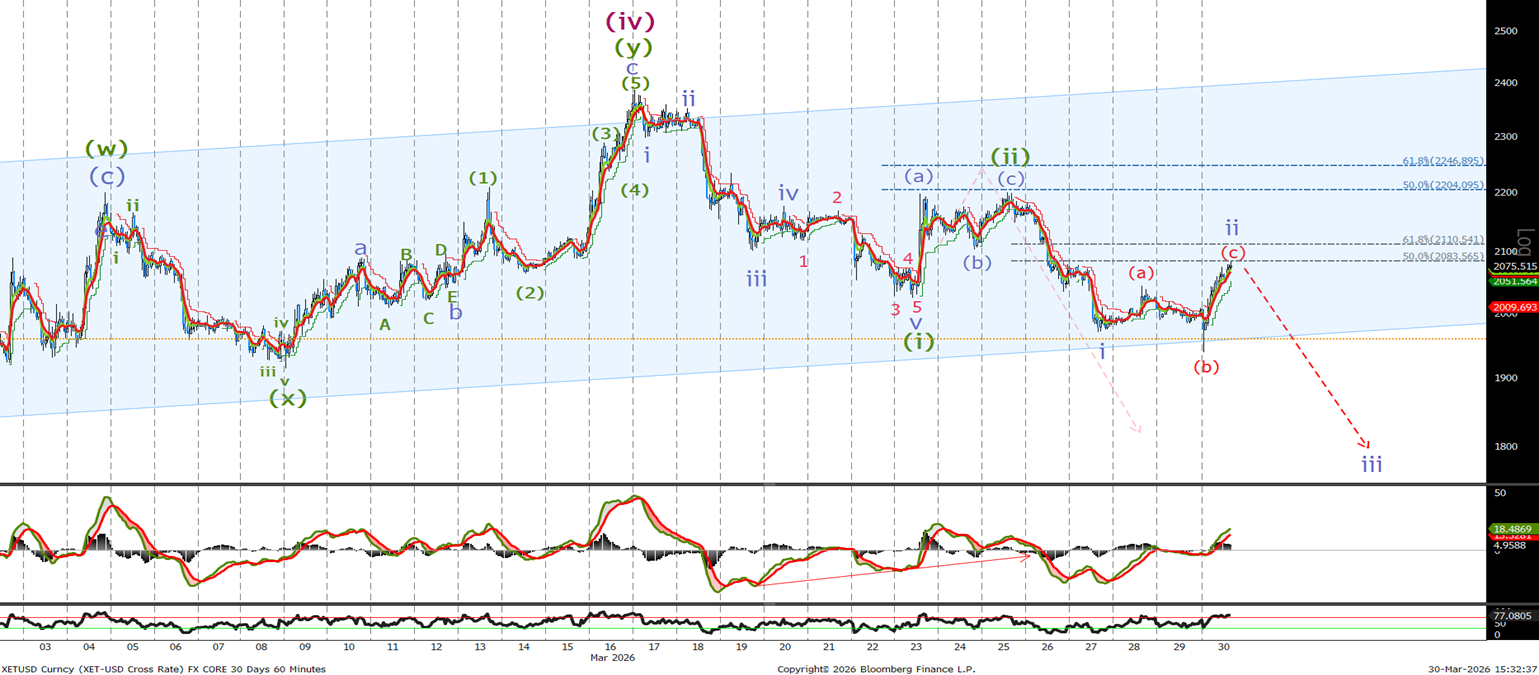
Last time I said ‘We traded to 2385 before, as you can see trading lower in 5 waves. We bottomed at 2022 this morning before a sharp spike higher, which I am calling wave (a) of a 3 wave correction. Look for another leg higher towards the 2240 level where we will sell with stops now above last week's high. A break below 2022 will confirm wave (iii) is underway.’ We broke the 2022 tested the bottom of the channel and are currently correcting in wave (c) of wave ii. E have just hit the 50% retracement level at 2083. Sell now and again at 2110 with stops above last weeks high at 2210. Look for an acceleration to the downside on a break of last weeks lows at 1937 and a close below the blue channel.