
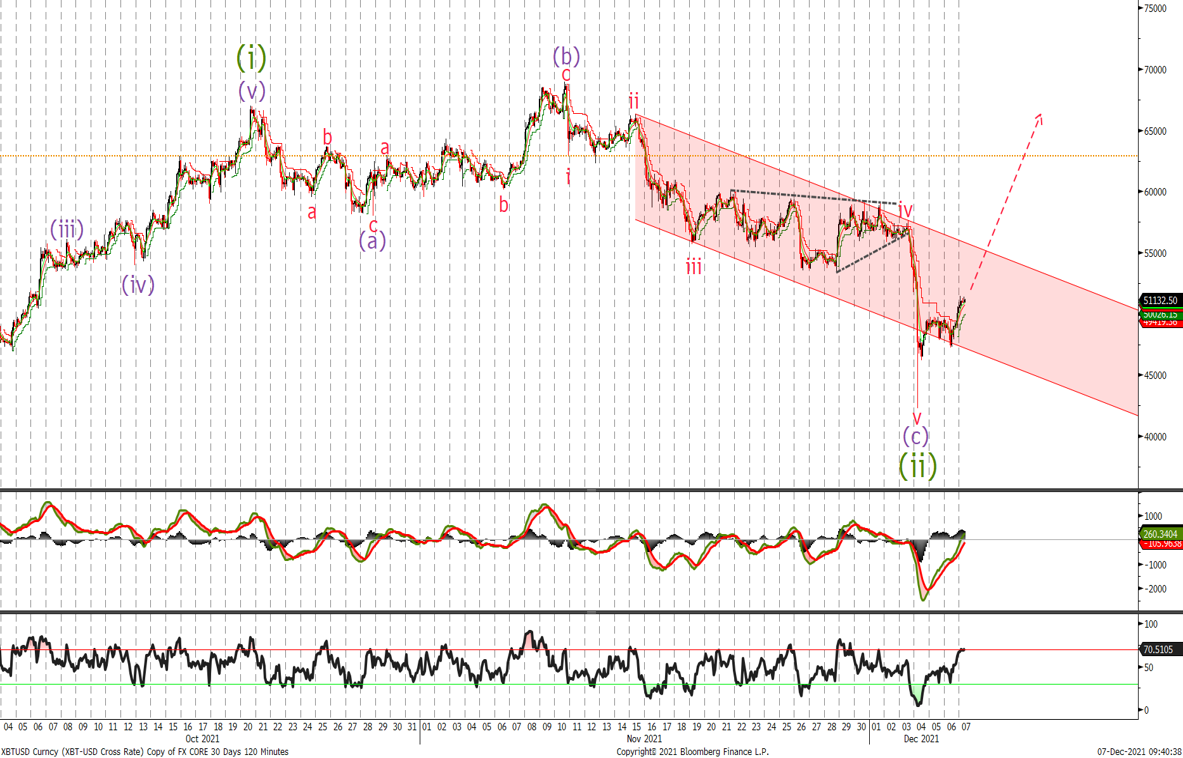
Bitcoin
Last Friday's sell off stopped us out 44k with Bitcoin crashing down to 42'296. Currently we are trading at 51'200 and a move above 52'000 will be the first confirmation that a low is in place for the next leg higher in BTC. If going long now place stops below 46'800 with a break there indicating the sell off has further to go and a new low below last week would be on the cards. Overall we still would like to accumulate BTC with an acceleration expected on a close out of the channel followed by a break of 58'000.
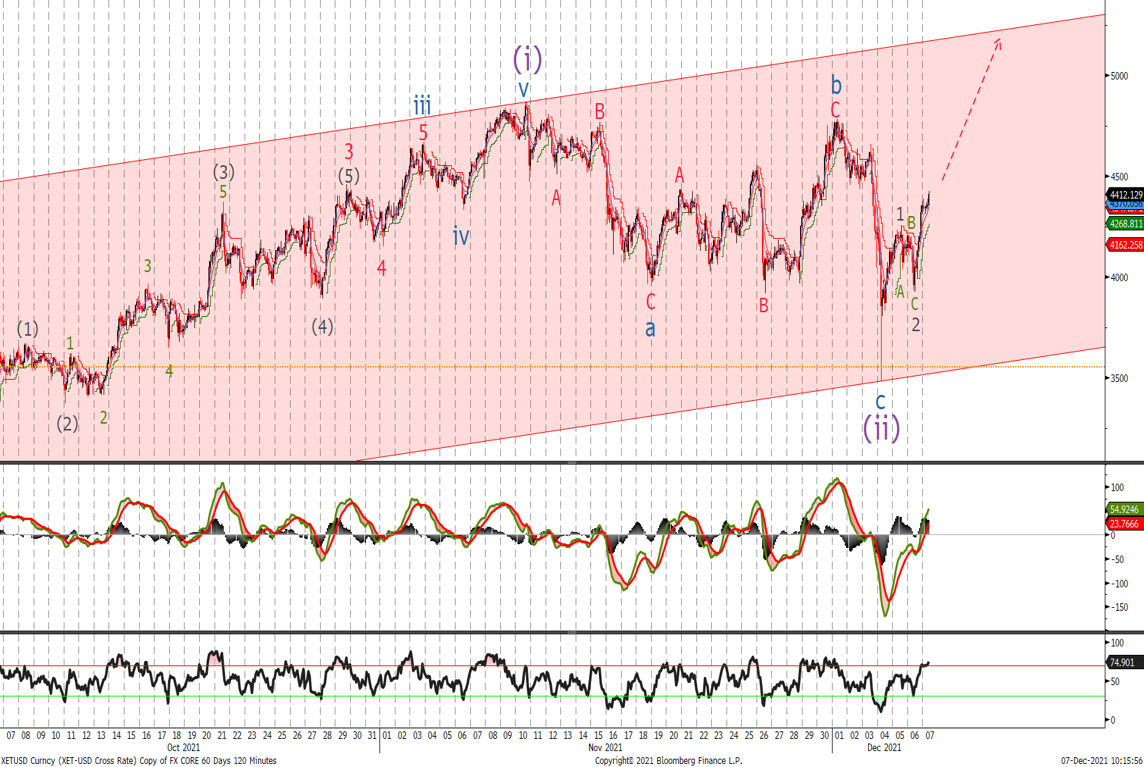
Ether
Last time we said:
'There is a possibility that ETH hasn’t finished its wave (ii) correction and a break of last week 3'918 low will confirm this so I would place stops below with the opportunity to buy them back cheaper’
We traded up to 4'782 before crashing down to 3'482 so we remain bullish as we didn’t hit the 3'416 long term level. Looking at the wave count it is more likely than BTC, that a low has been seen for Ether. A move above 4'460 should confirm wave (iii) higher and we are looking for an acceleration to new highs above 5'000 going into year end. Look to buy on dips with stops at 3'416.
Written by Matthew Clark
