Bitcoin Weekly Chart
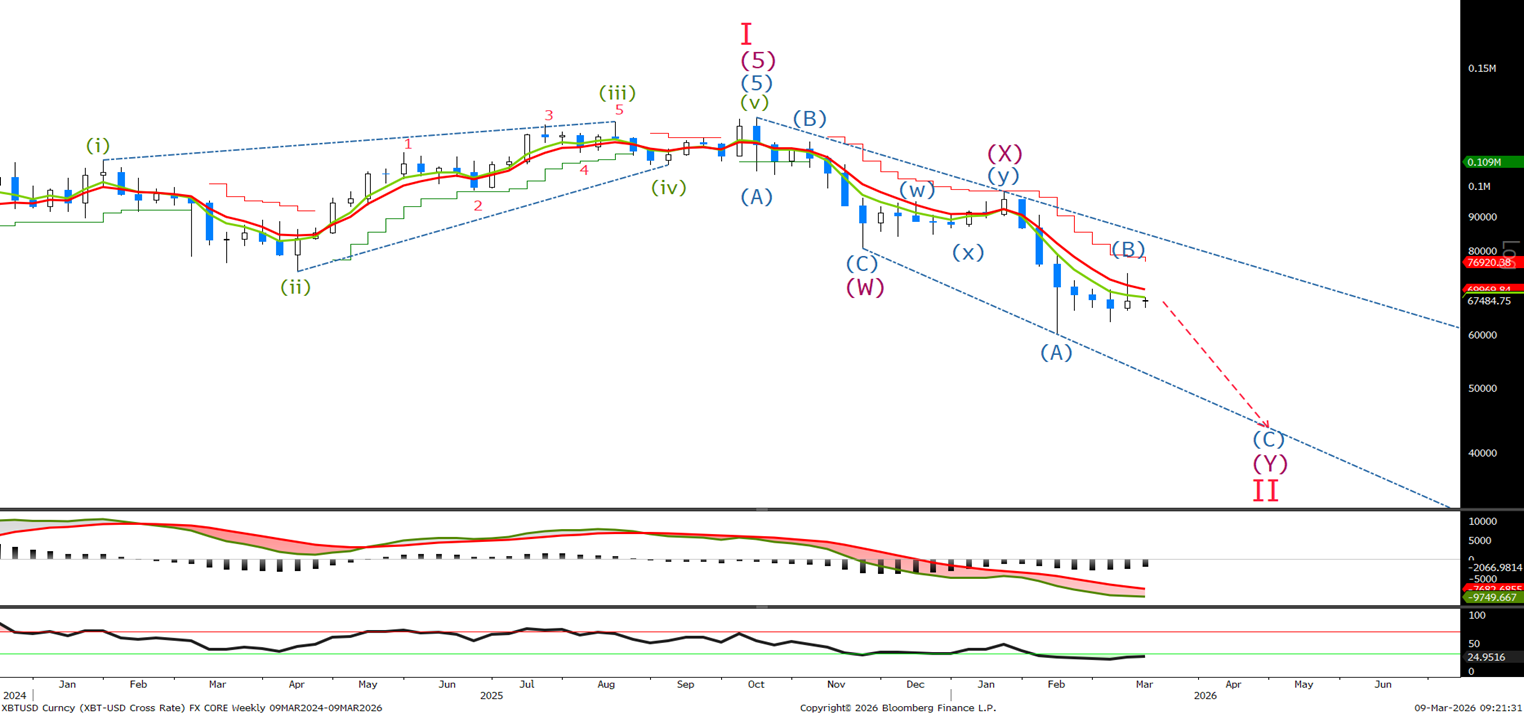
Last time we said ‘A break above does not negate the bearish view with a larger zigzag correction taking place but I will update the charts if that occurs.’ So we made a slight new high in wave C negating the triangle view. So I am now showing my preferred view which could turn out to be more bearish that the previous view.
Bitcoin Long Term Chart
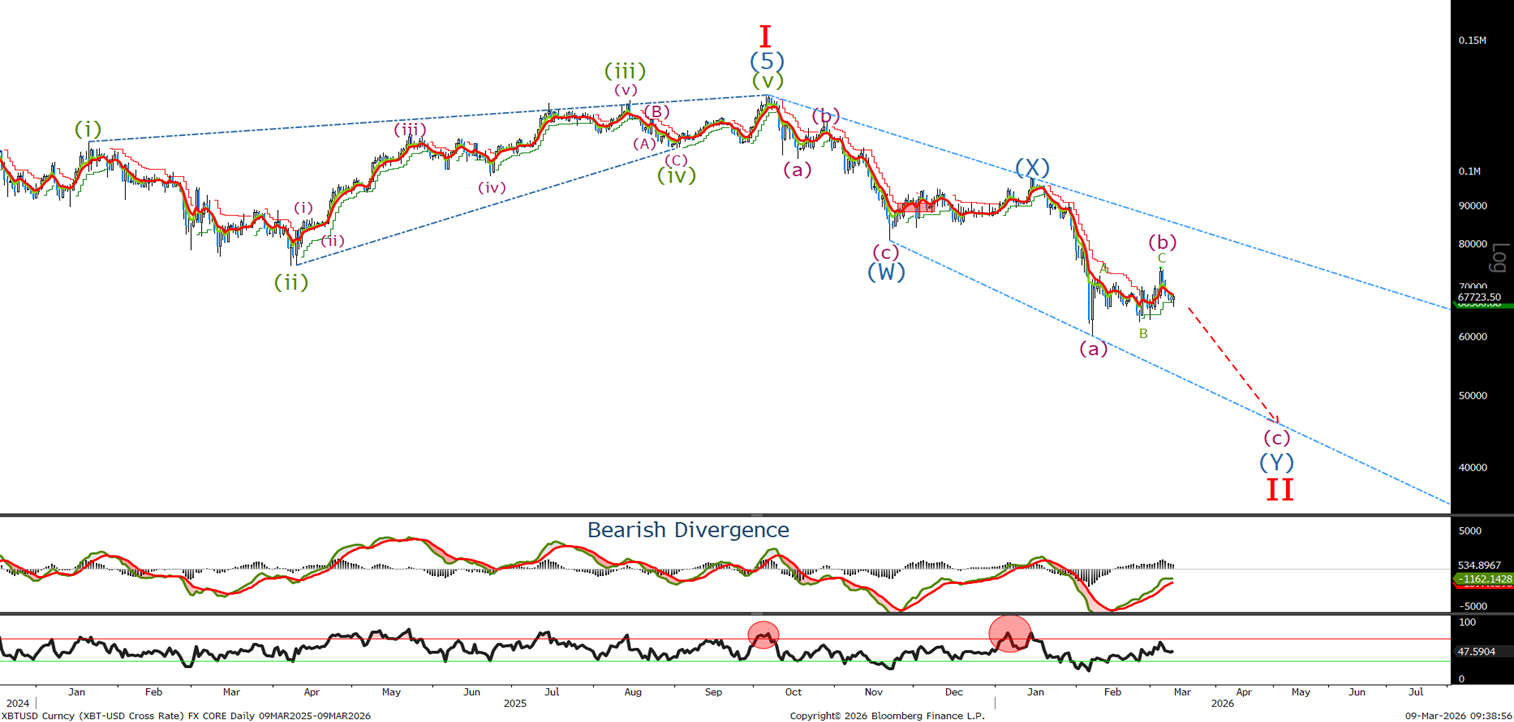
If we break the sell off down now into the daily chart It appears that we have completed wave (b) and are entering the final leg of this correction towards the bottom of the channel and the 40000 level. Lers go to the short term for possible entry levels .
Bitcoin Short Term Chart
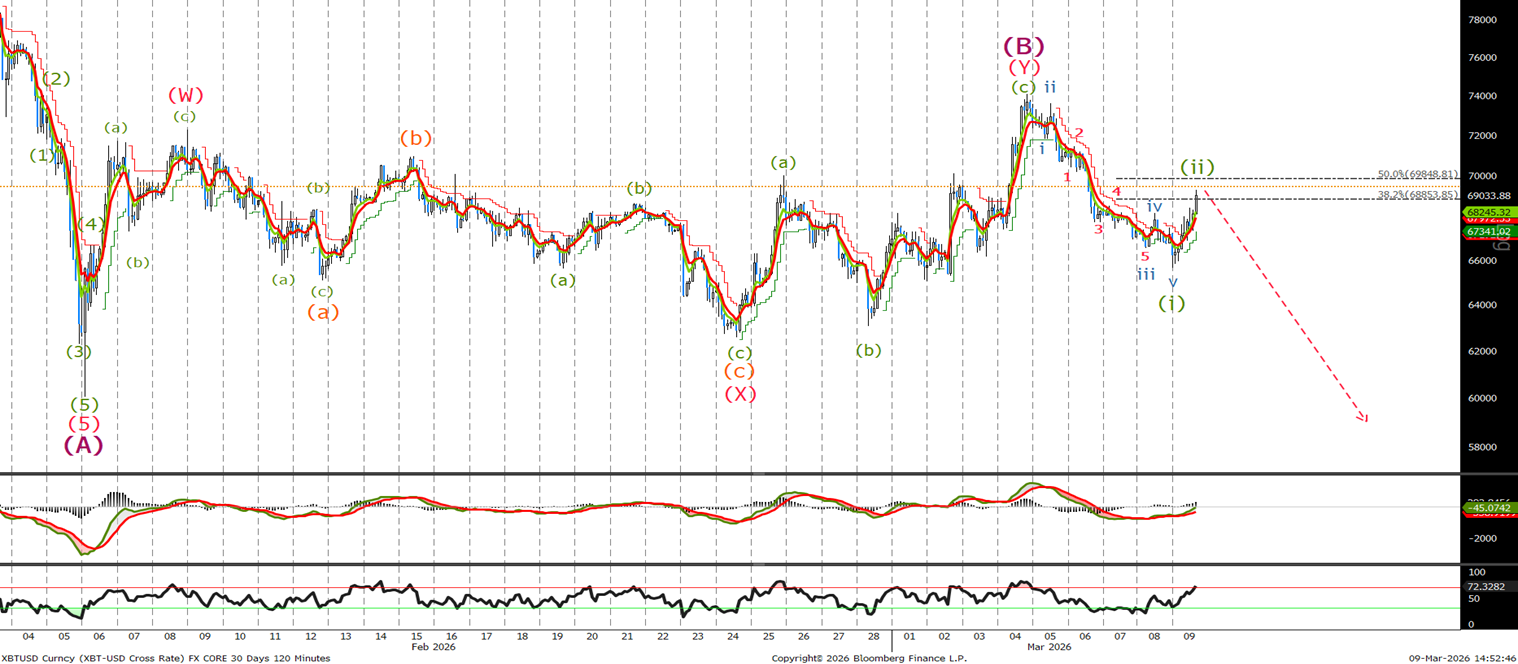
Last time we said there was the possibility ‘the current rally represent wave (c) of a triangle as shown, or, wave (c) of a zigzag.’ The zigzag turn out to be the correct view. Since the high in wave (B) , previously thought wave (c) of a triangle, we have sold off in 5 wave and are currently correcting in wave (ii) I would sell now at 68750, sell again at 70k and 71k with stops above last weeks high at 74100.
Ethereum Long Term Chart
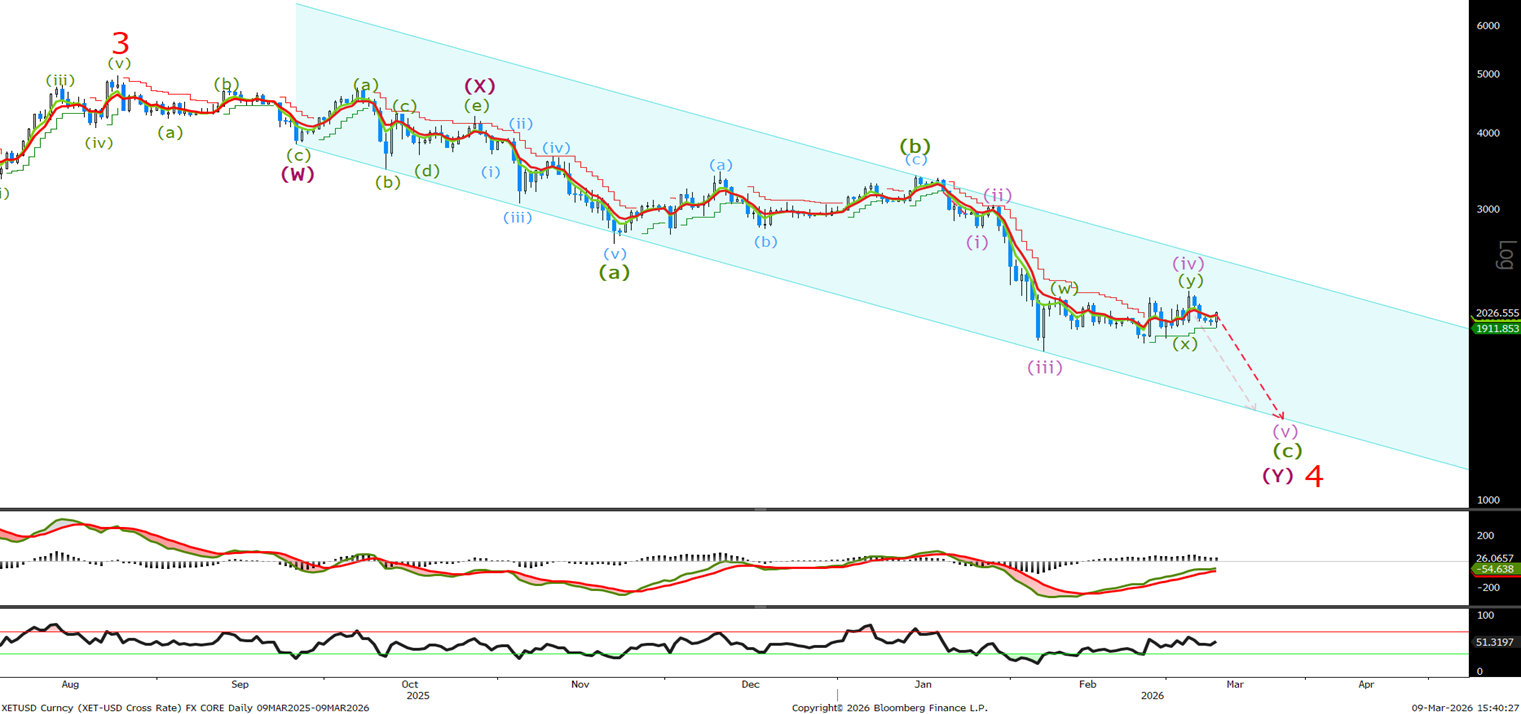
Last week I said ‘There is a possibility of a zigzag correction and a move up towards the top of the channel at the 2500 level, but over all we are still looking for a final push to new lows before the bull trend resumes.’ Slight change in the count for the correction but the bearish view remains valid.
Ethereum Short Term Chart
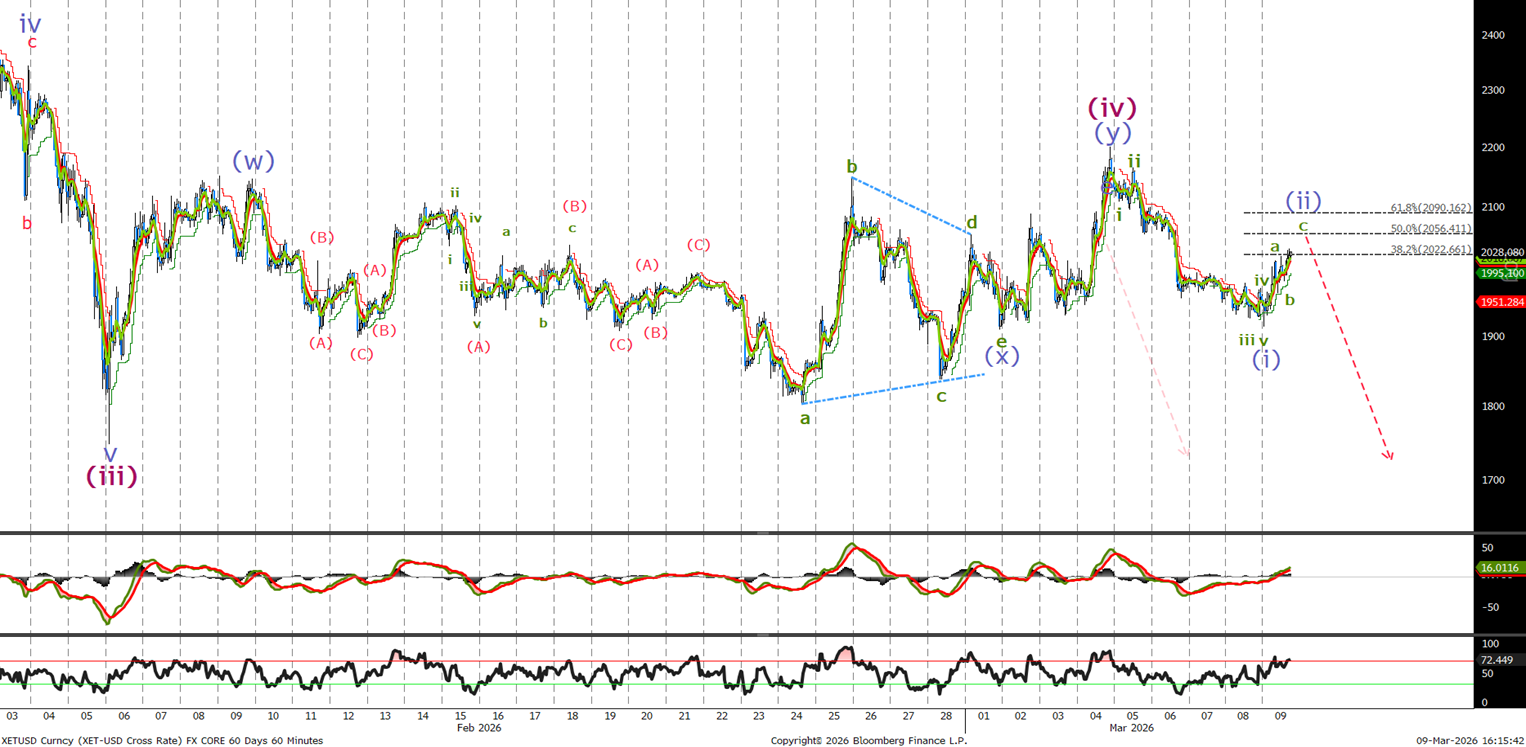
We are currently testing the 38.2% in what could be the end of the wave (ii) correction. Sell now and add at 2055 and 2090 with stops just above last weeks high at 2220.