Bitcoin Weekly Chart
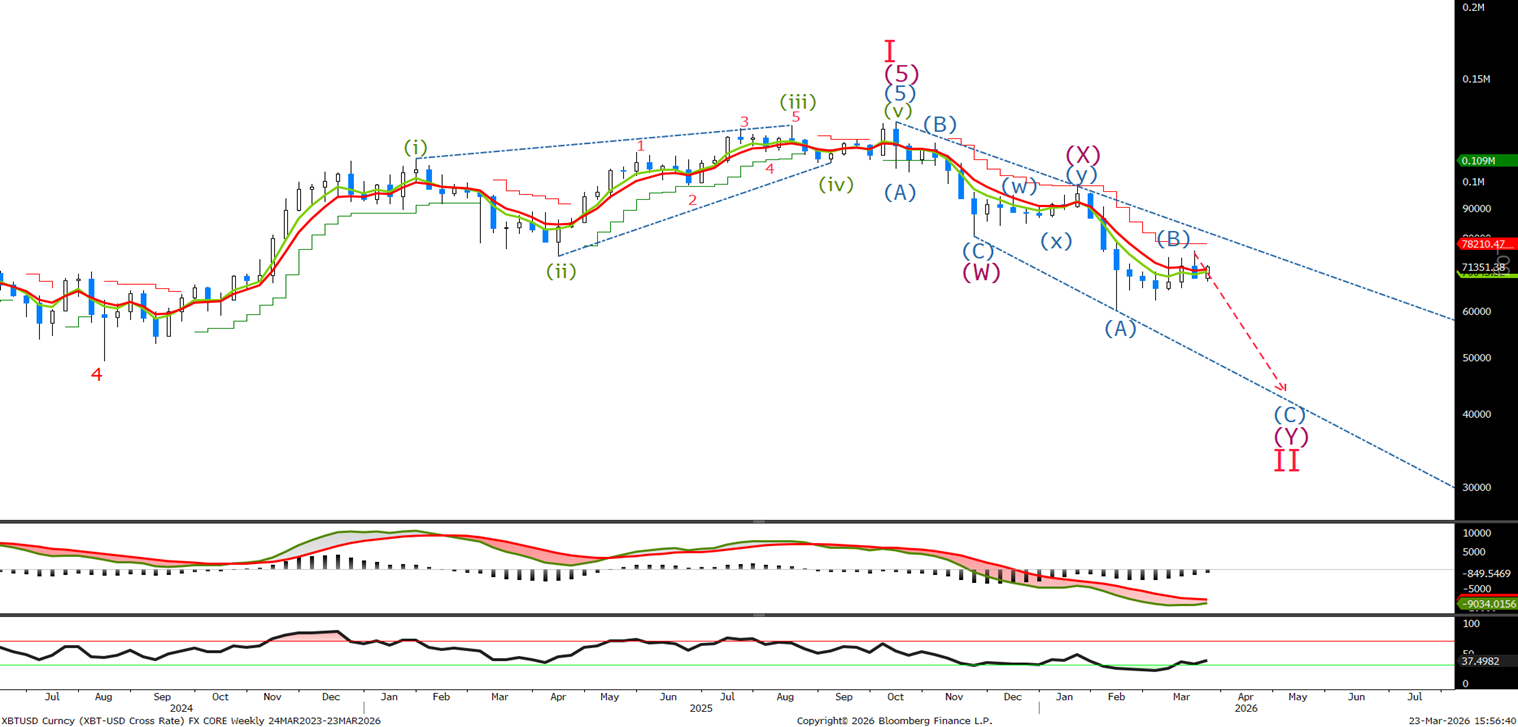
Last time I said ‘No change in the Weekly view as we continue to wait for wave (B) to end before the next leg lower.’ I believe it has, I will show why on the short term charts.
Bitcoin Daily Chart
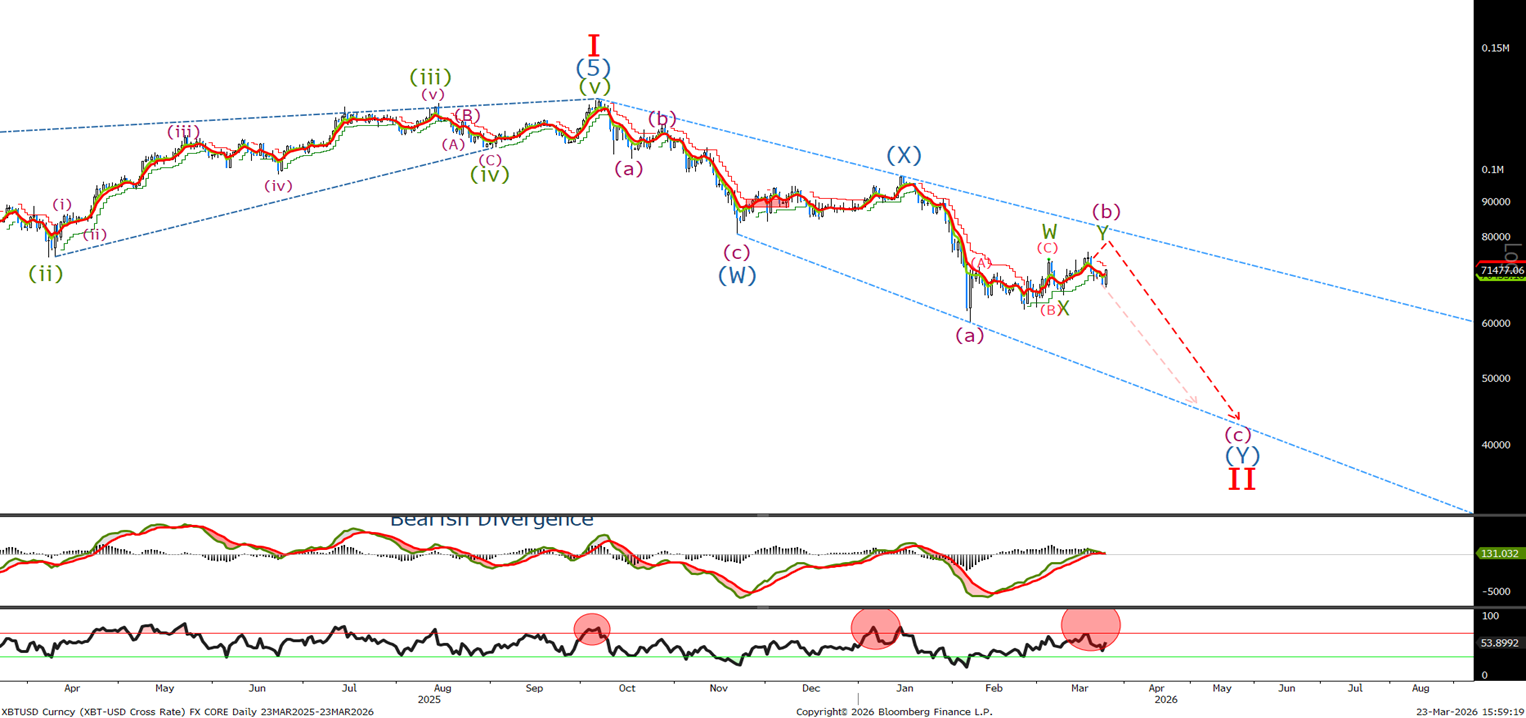
Last time we said ‘we are looking for higher towards the top of the wedge before the sell off discussed last week.’We traded higher to 75997 before selling off. If we look to the 2 hour chart we can see if there is a confirmation that odds favor a top.
Bitcoin Short Term Chart
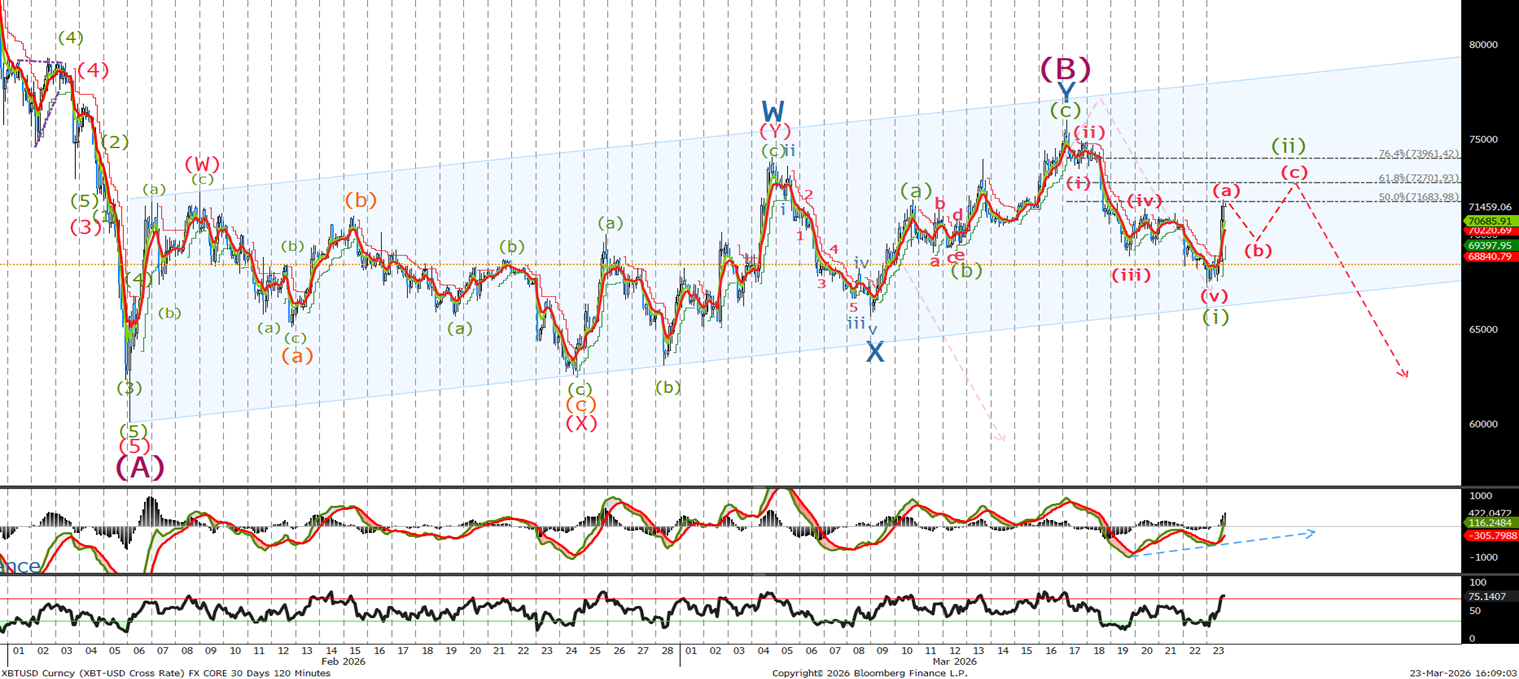
Last time we said ‘It would appear to me that we need to trade towards the top of the channel and then 79100 level. I would look to sell as we approach there with stops above 91200. Interestingly, wave Y=W at 79095 and wave (B) = 0.5 (A) at 79245 , so I look to sell higher.' The high was 75997 before selling off in 5 waves to what I am calling wave (i) i believe we are correcting in3 waves and will look to sell at 72.5 and 74K level with stops above last week's high for a push below 66000.
Ethereum long Term Chart
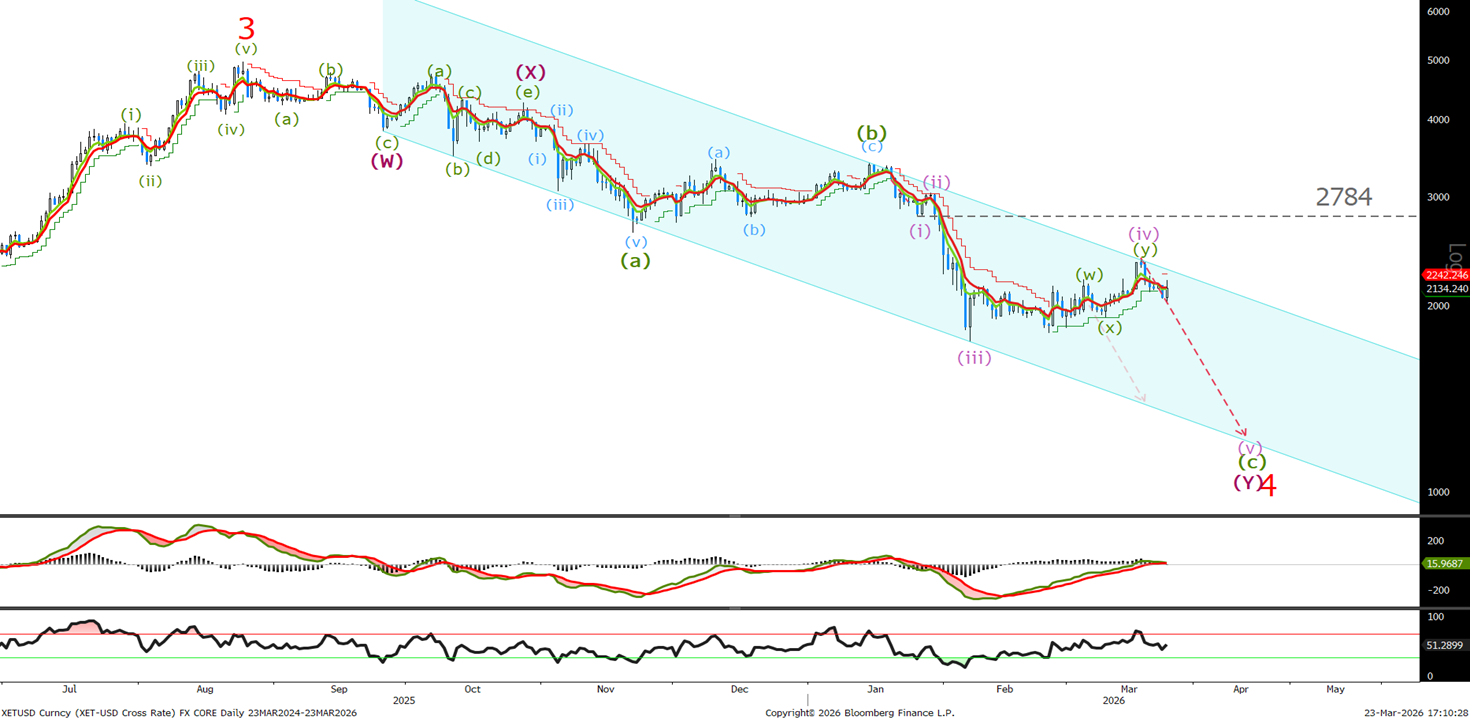
Last week I said ‘Friday's highs put a larger WXY correction as our preferred count, which once complete will ultimately lead to a 5 wave sell off towards the 1250 level.’ We tested the top of the channel and sold off inline with expectations. Let's look for confirmation of a 5 wave sell off in the short term.
Ethereum short Term Chart
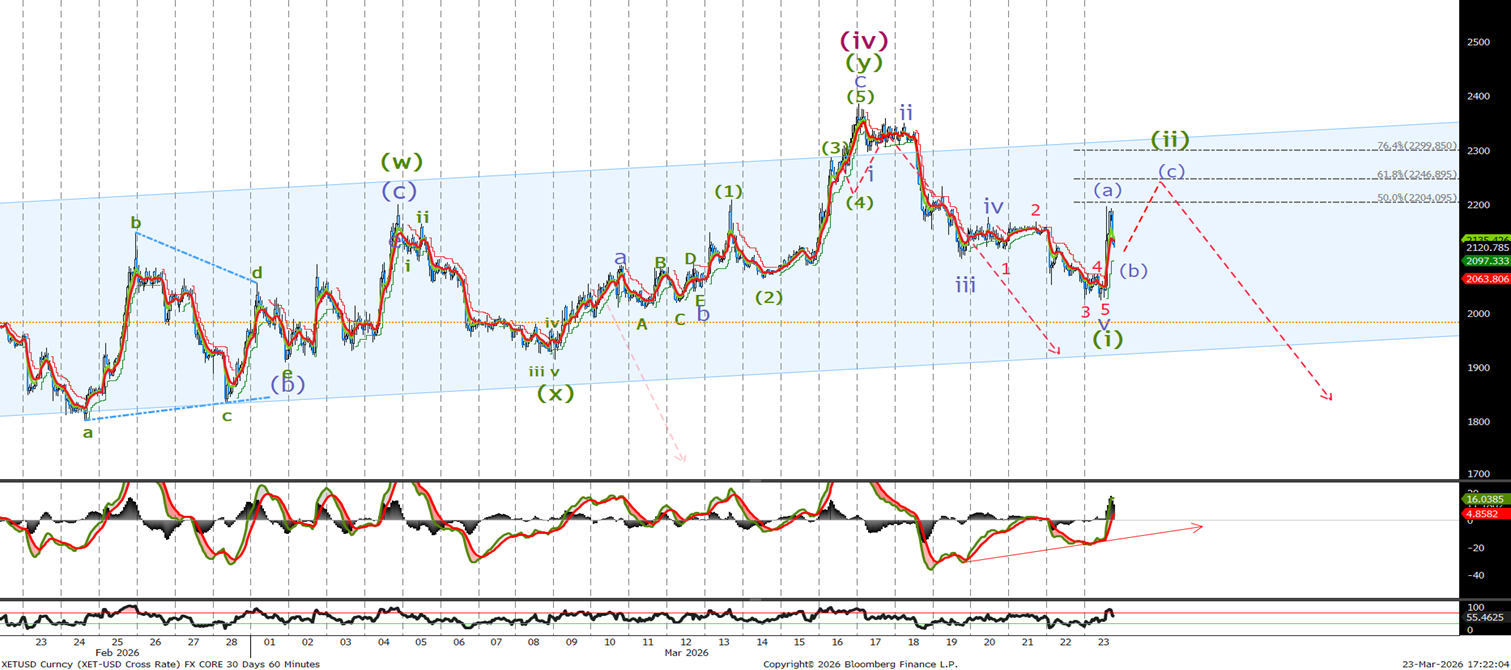
Last time I said ‘I am looking for ETH to push higher in the coming hours to test the top of the channel around the 2320 area. Once this final wave is complete, we expect to see a sell-off with a break of 2060 being the first confirmation that ETH is starting its wave (v) to new lows.’ We traded to 2385 before, as you can see trading lower in 5 waves. We bottomed at 2022 this morning before a sharp spike higher, which I am calling wave (a) of a 3 wave correction. Look for another leg higher towards the 2240 level where we will sell with stops now above last week's high. A break below 2022 will confirm wave (iii) is underway, and I expect to see a sharp sell-off once broken..