
Bitcoin Weekly Chart
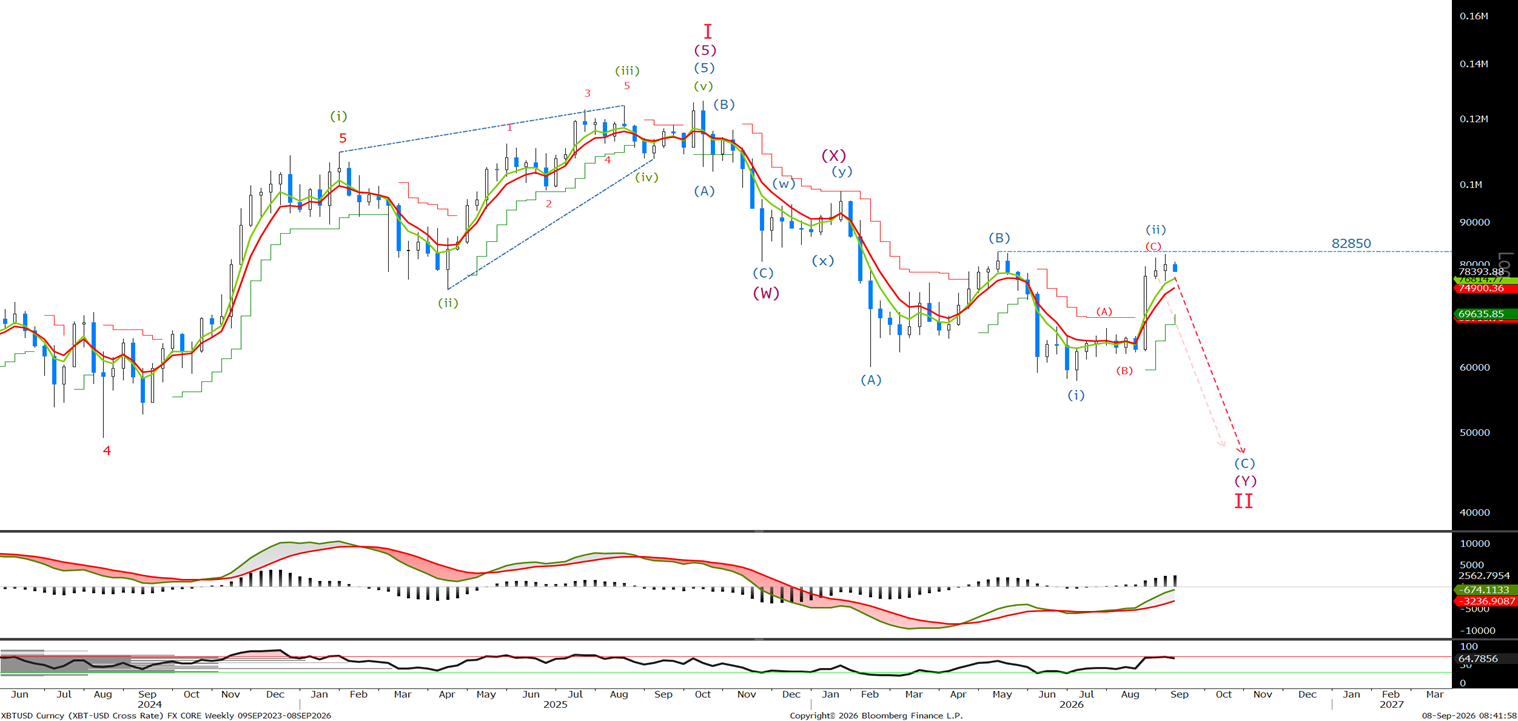
No change on the weekly with 'The limit for wave (ii) is 82850. Let's look to the short term to see how far along we are in wave (C) and if it looks like ending before 82850.' I remain bearish whilst below that level. The high so far has been 82266 last week.
Bitcoin Daily Chart
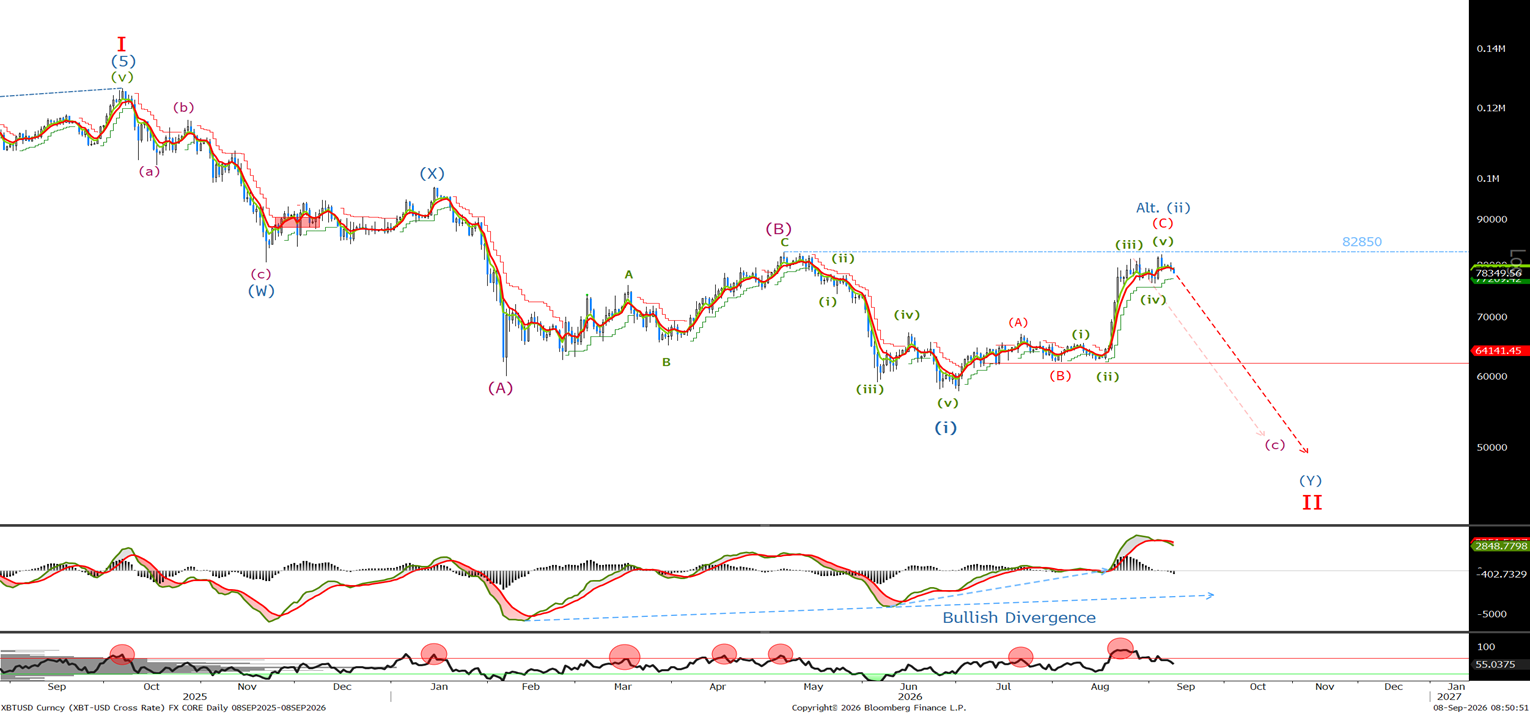
Last week I said ‘sell now at 77110 with stops above last week's high.’ We broke the high at 81441 before reaching 82266. I am happy to be short below 82850, so I am selling now with stops above 82850.
Bitcoin Short Term Chart
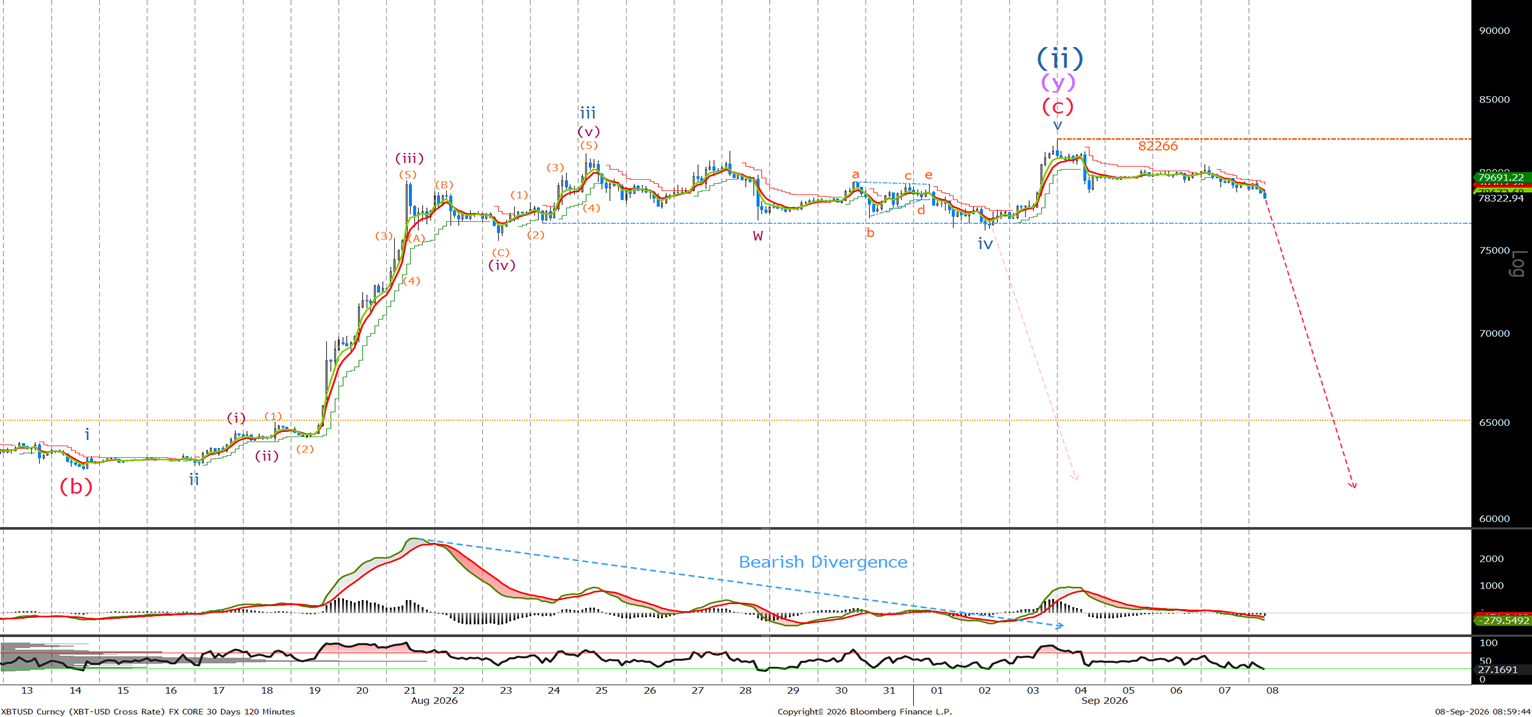
Last time we said as we were already short ‘Leave stops at 82850 or slightly above last week's high. Given the bearish divergence, I expect to see an acceleration on a 2-hour close below 76650.’ No change whilst below 82850 and will add on a 2 hour close blow 76650.
Ethereum Long Term Chart
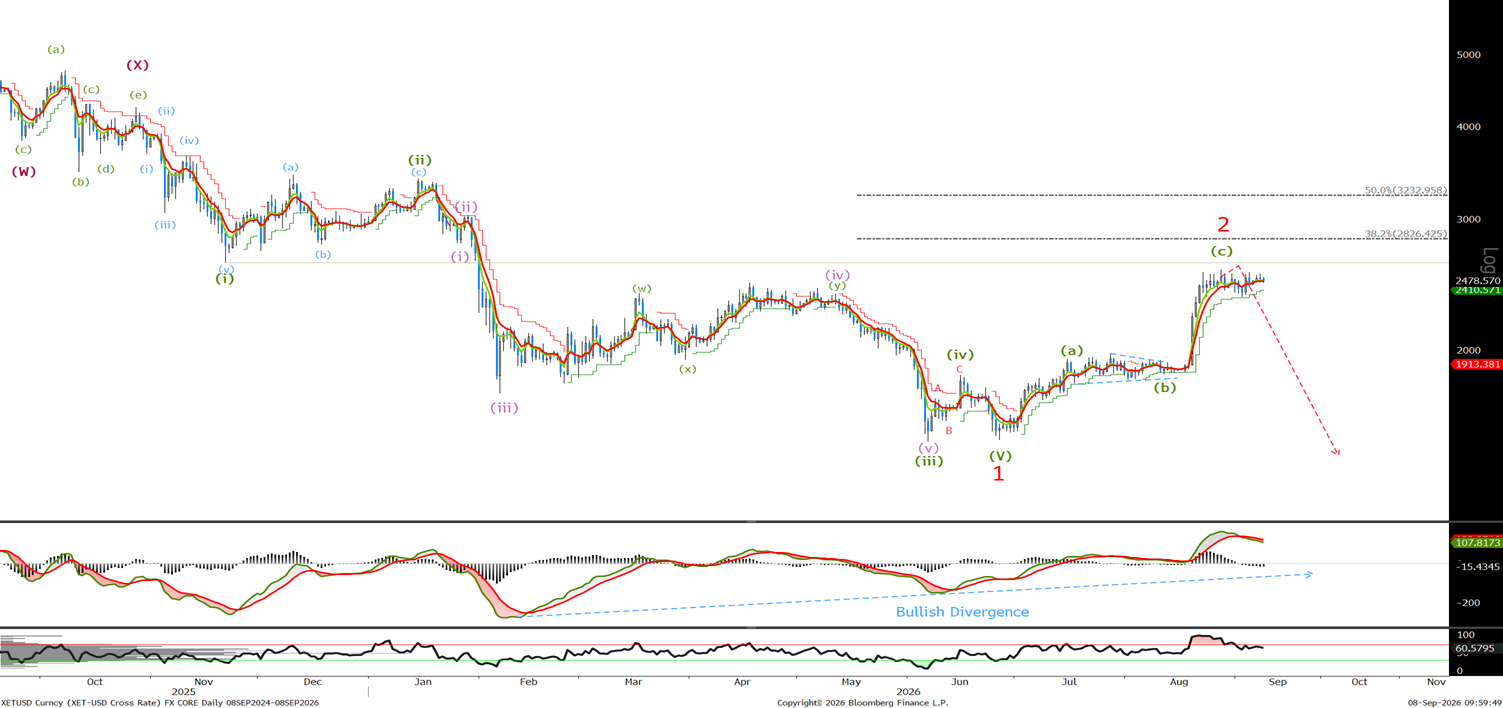
Last week we were looking for lower whilst below 2620 and were looking for confirmations that ‘ A daily close below 2350 should confirm the downtrend has resumed.’ I would have liked to see a sharper sell-off over the last 2 weeks but let's look to the short term for greater clarity.
Ethereum Short Term Chart
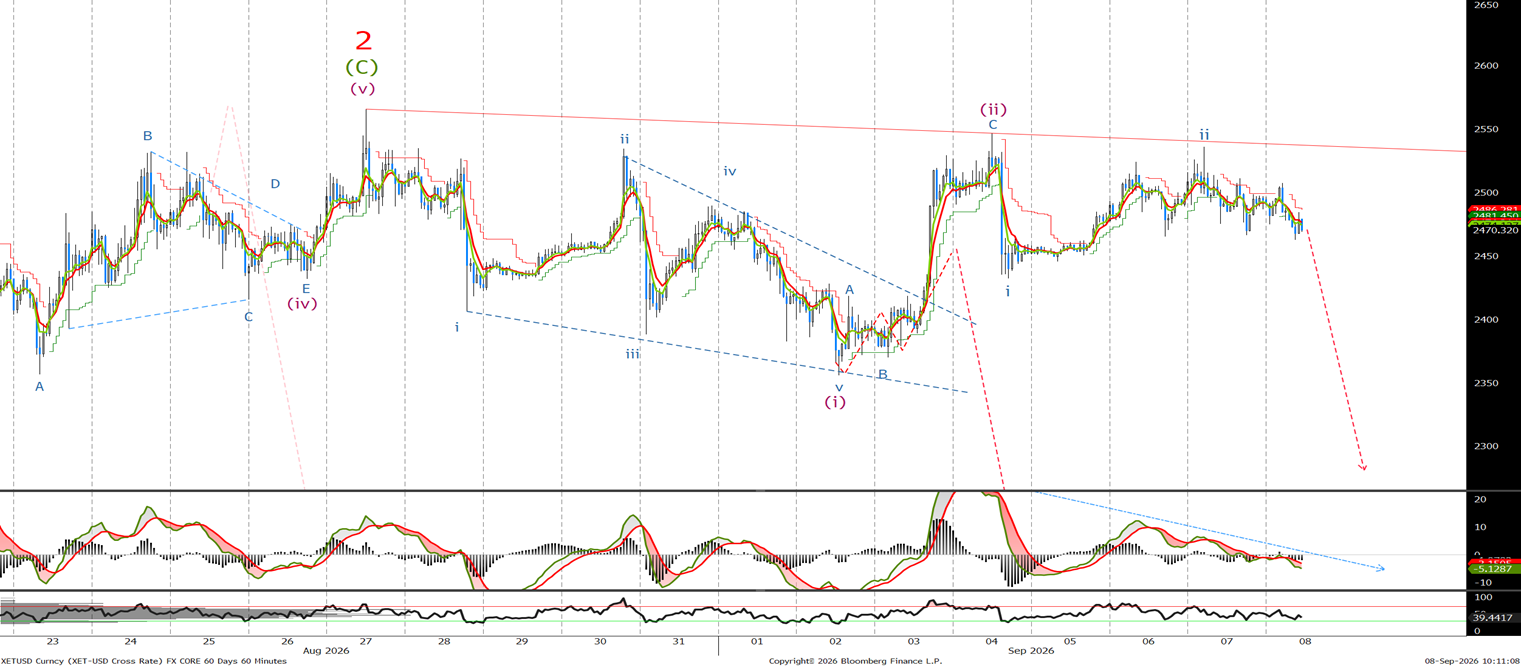
Last time we said, ‘it appears we are close to finishing the 5 legs to complete wave (i). Place stops above 2570 now. If not short, look to sell on a correction back to the 2439 and 2463 levels.' We traded higher than expected but remained below our stop-loss level. We are currently trading at 2470, so if you didn't sell on the correction, sell now with stops remaining at 2570. There is a possibility that we are tracing out a corrective triangle for an ongoing wave (iv) in the long-term chart, that call for one more push higher before the wave 2 is over, but I will show that if it comes into play and prefer to remain bearish at this time.