
Bitcoin Weekly Chart
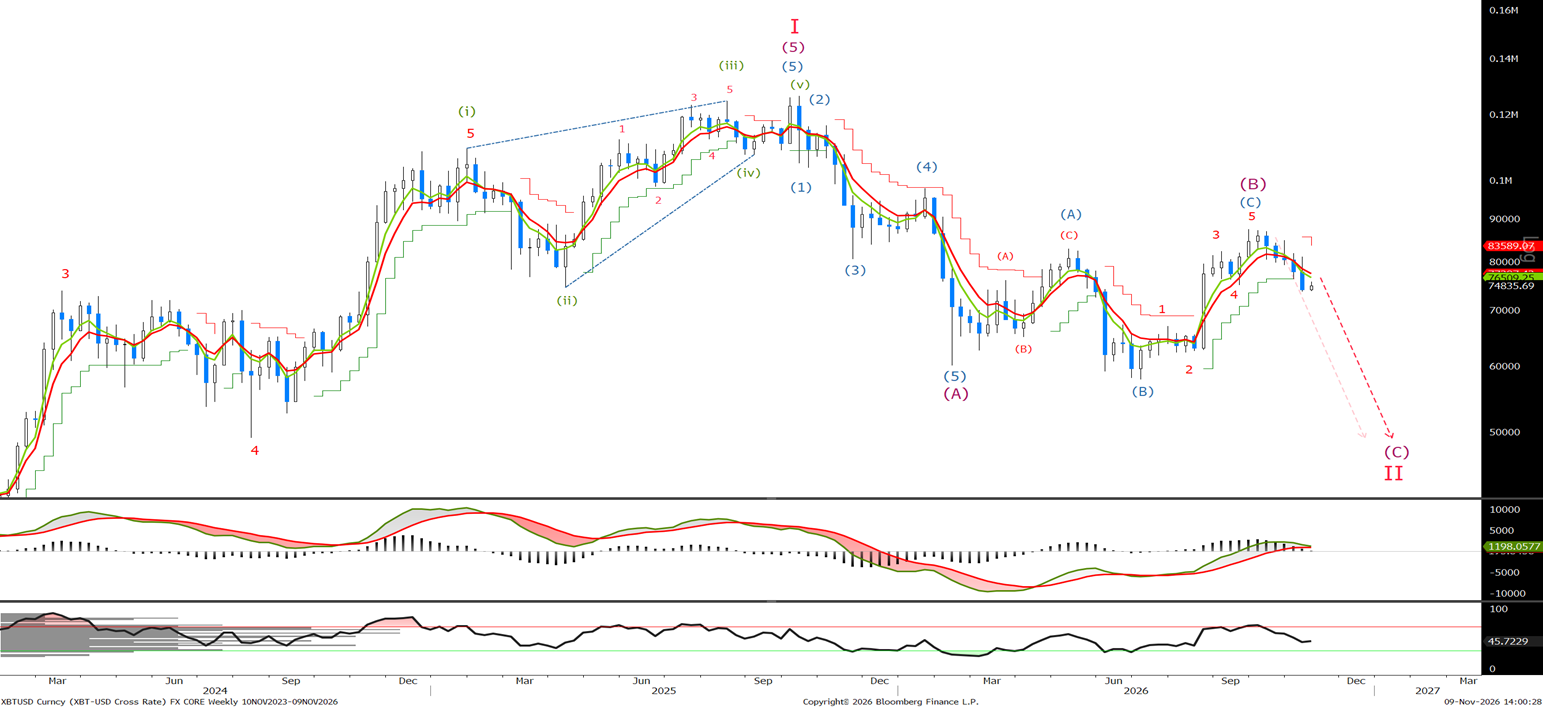
We have been waiting several weeks for 'a weekly close below 76250 to confirm the weekly trend lower. I expect an acceleration on a weekly close below 76250.' We closed at 73165, confirming the long-term downtrend. Let's look to the shorter term charts now for possible sell levels if not short already.
Bitcoin Daily Chart
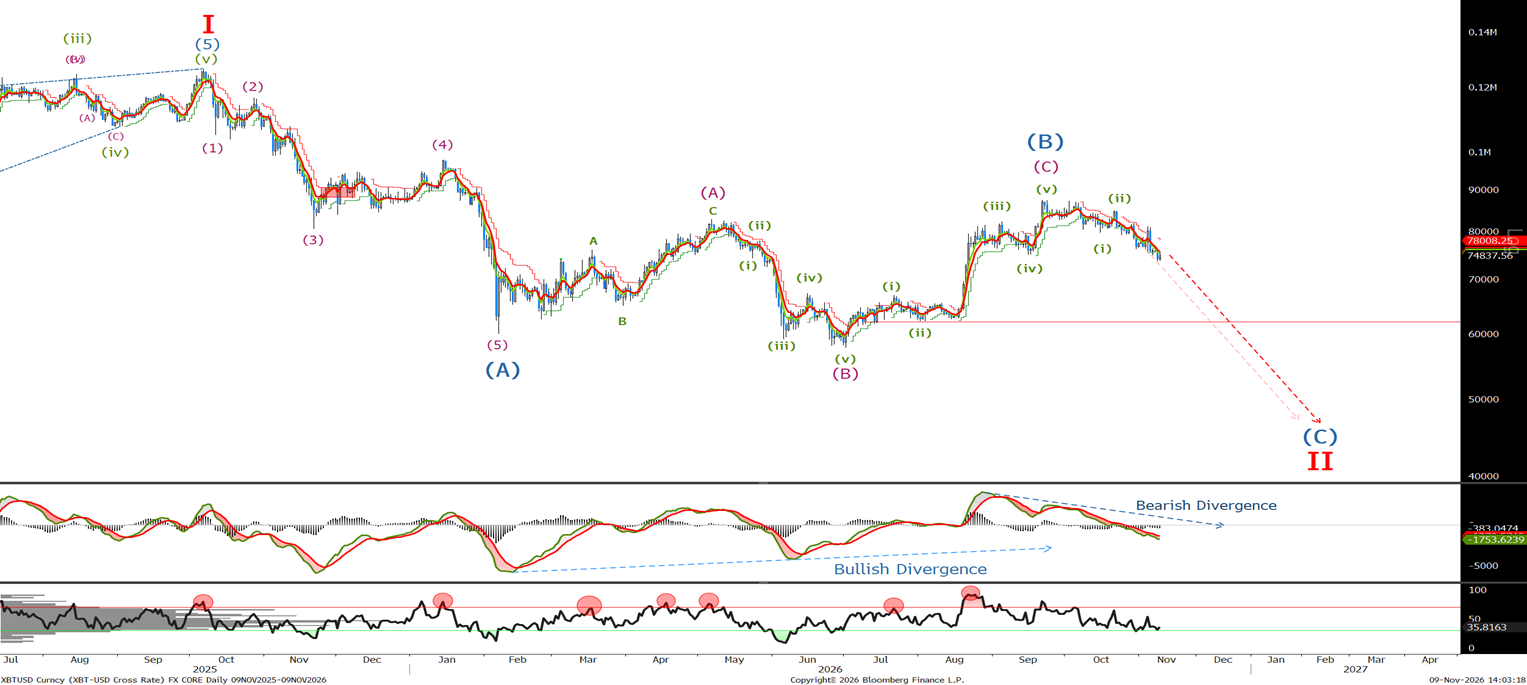
On a daily basis, there is no change to our bearish view: ‘BTC continues to make lower lows, and it appears we are at the start of wave (iii). Let's look at the short-term charts for possible sell levels.' Resistance should come in around 78670 and a move above 85100 would require a reassessment. But as you will see on the next page, I think you can sell higher than the current 74600 price.
Bitcoin Short Term Chart
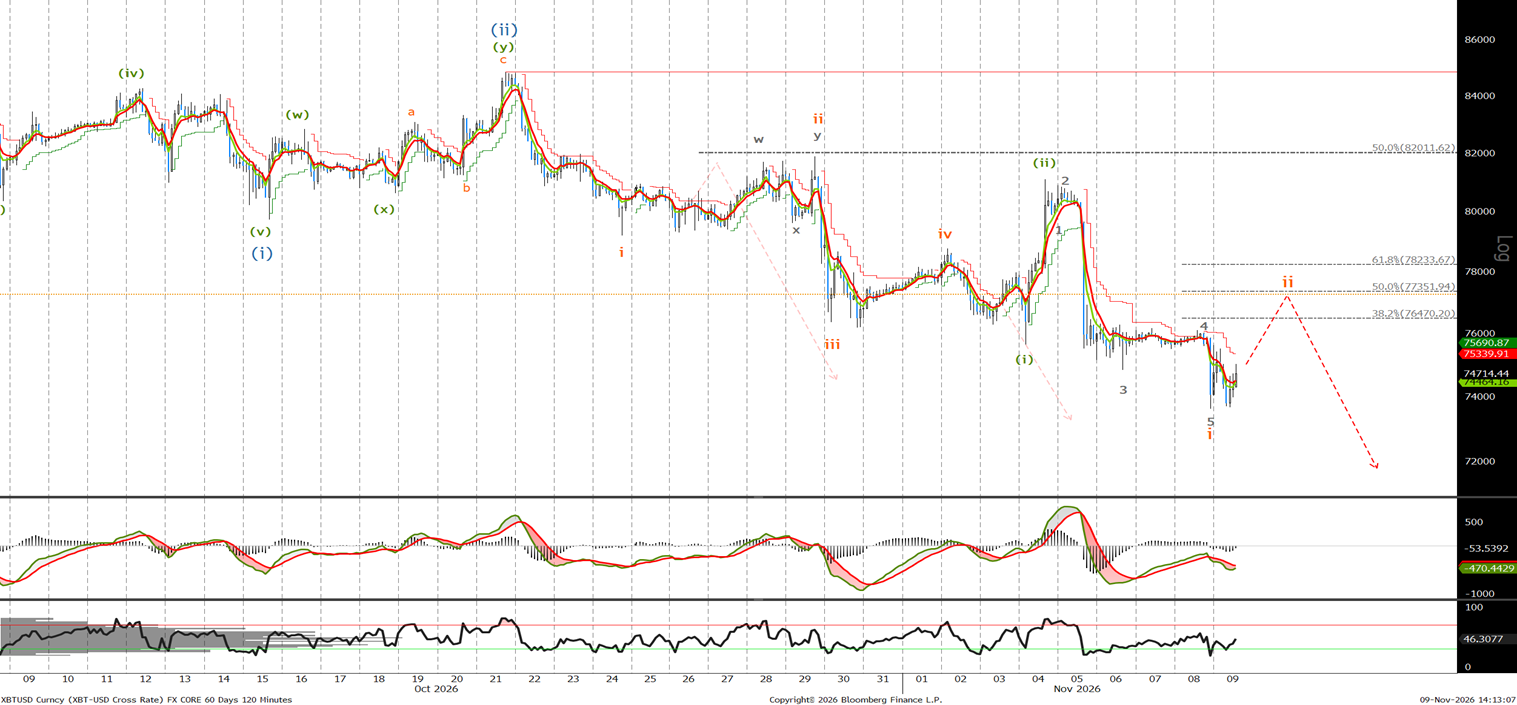
In the short-term chart, we said 'We traded up to 81877, enabling us to sell, place stops at 84900. Although I don't expect it to trade above last week's high, I would sell now and add on a pull back to 82k if not short already.' We traded to 81100 just shy of our other sell level before selling off to 73615 to complete the first leg of wave (iii). I expect BTC to retrace back to 76470, 77350 and possibly 78230. I will sell at each of those levels with stops at 82.1K or remaining at 84900.
Ethereum Long Term Chart
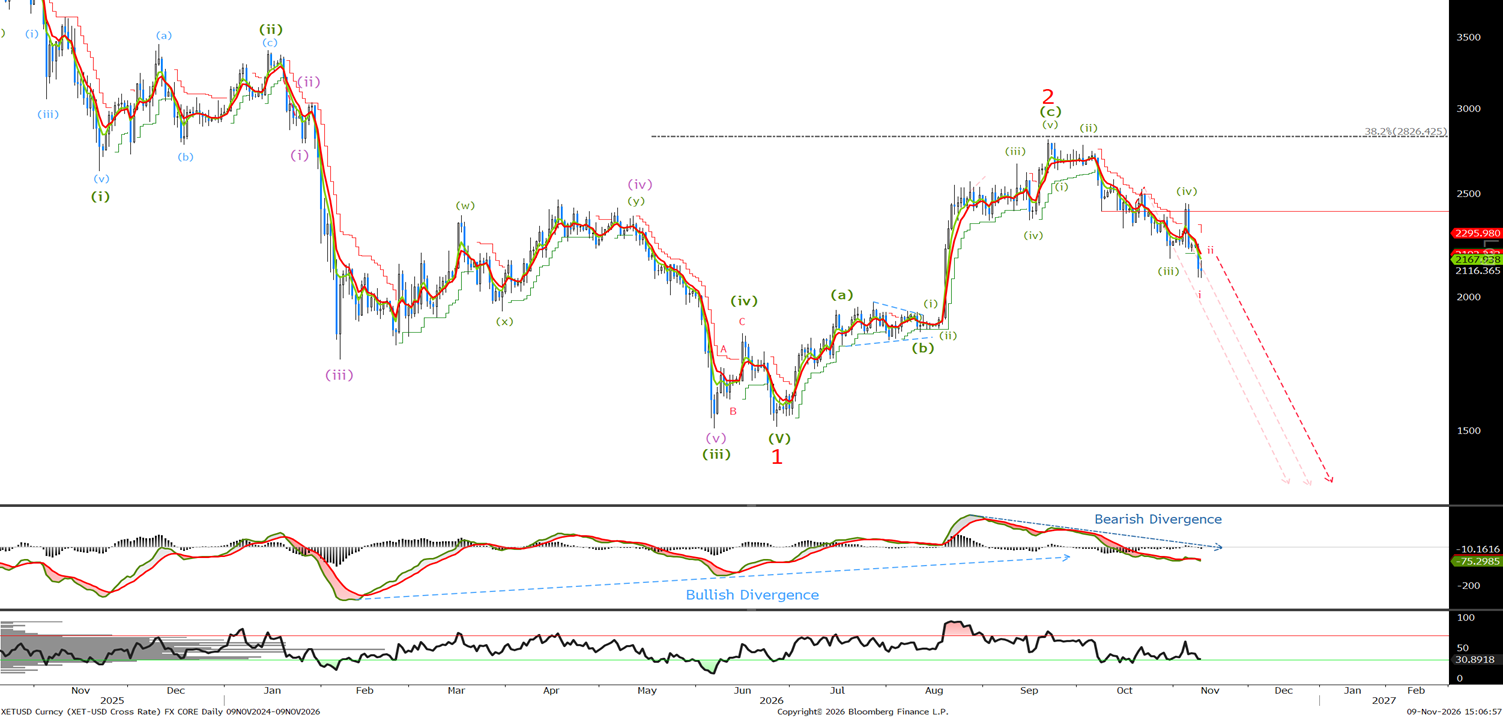
Last time, on a daily basis, we said ‘No change in our view as we expect to continue ETH to continue selling off in wave (iii).' It looks as if we have completed wave (iii) and (iv), so let's look to the short-term chart for possible sell levels.
Ethereum Short Term Chart
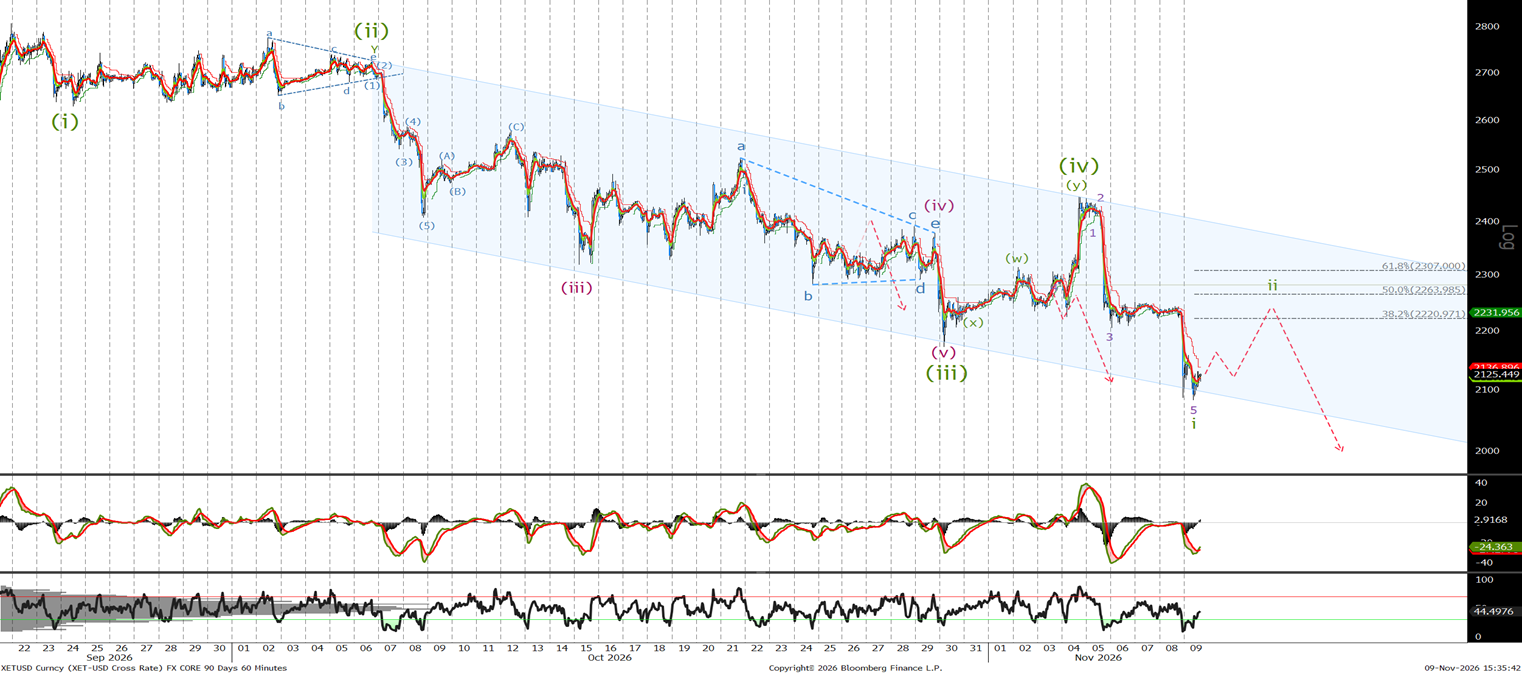
Last week I said, 'We traded up to 2389, enabling us to sell at 2373 before selling off. I would look to sell now at 2264 with stops now at 2420 or remaining at 2523 depending on your risk profile.' We traded up to 2446, and I would use that level as a stop loss level now on short positions. Look to sell at 2220, 2260 and 2300. The area of the previous wave 4 is often a resistance and that comes in between 2220-2250.