Bitcoin Long Term Chart
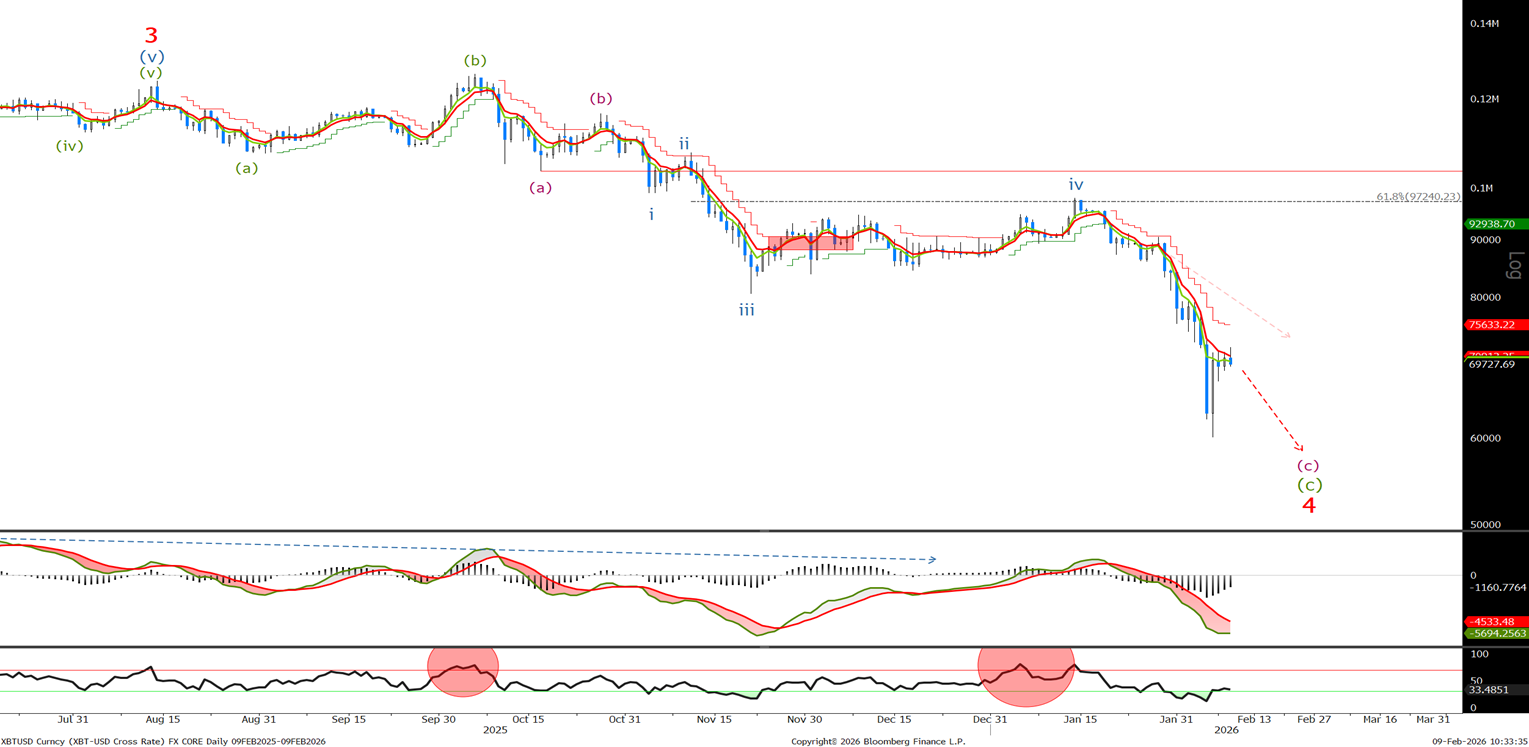
BTC sold off in line with expectations reaching a new low of 60033 before correcting. We need to look to the short term chart to see if that was the end of wave 4.
Bitcoin Short Term Chart
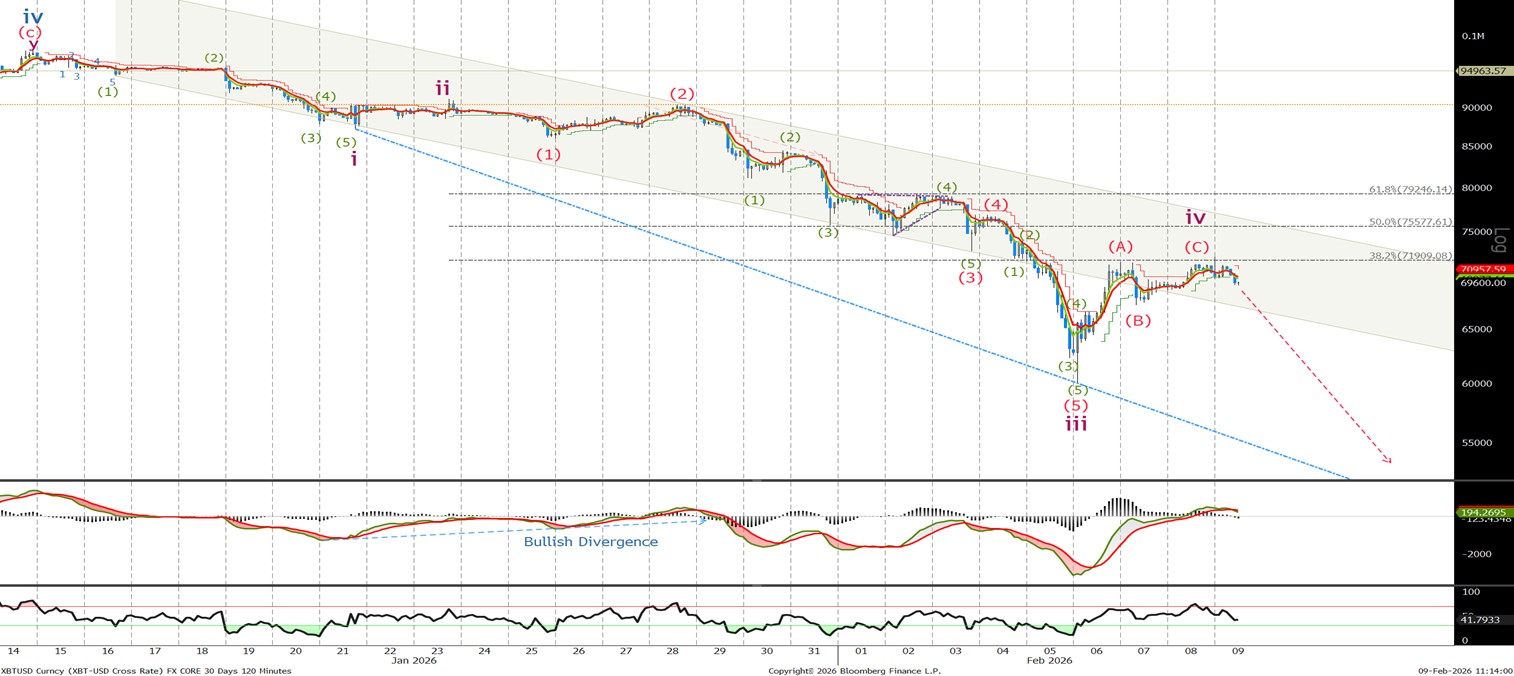
Last time we said ‘We should now correct higher in wave iv and it looks as if 2 of them have already been completed. Look for a rally to the 80570 followed by the top of the channel and the 50% retracement level at 82450. Sell there with stops above the wave ii high for push toward the 70k level.’ We traded to 79300 before selling off to 60033. Since then we have retraced in 3 waves to test the 38.2% level at 71909. I do not rule out a push towards the 50% level and the top of the channel at 75600. With no signs of divergence and downward momentum running out of steam I expect to see another sell off to new lows around the 55k level followed by a test of the 50k. We will look for 5 waves lower in this leg to complete the correction. We are still bullish long term and will use this next sell off to get long. A break above 88k will cast doubt on this view.
Ethereum Long Term Chart
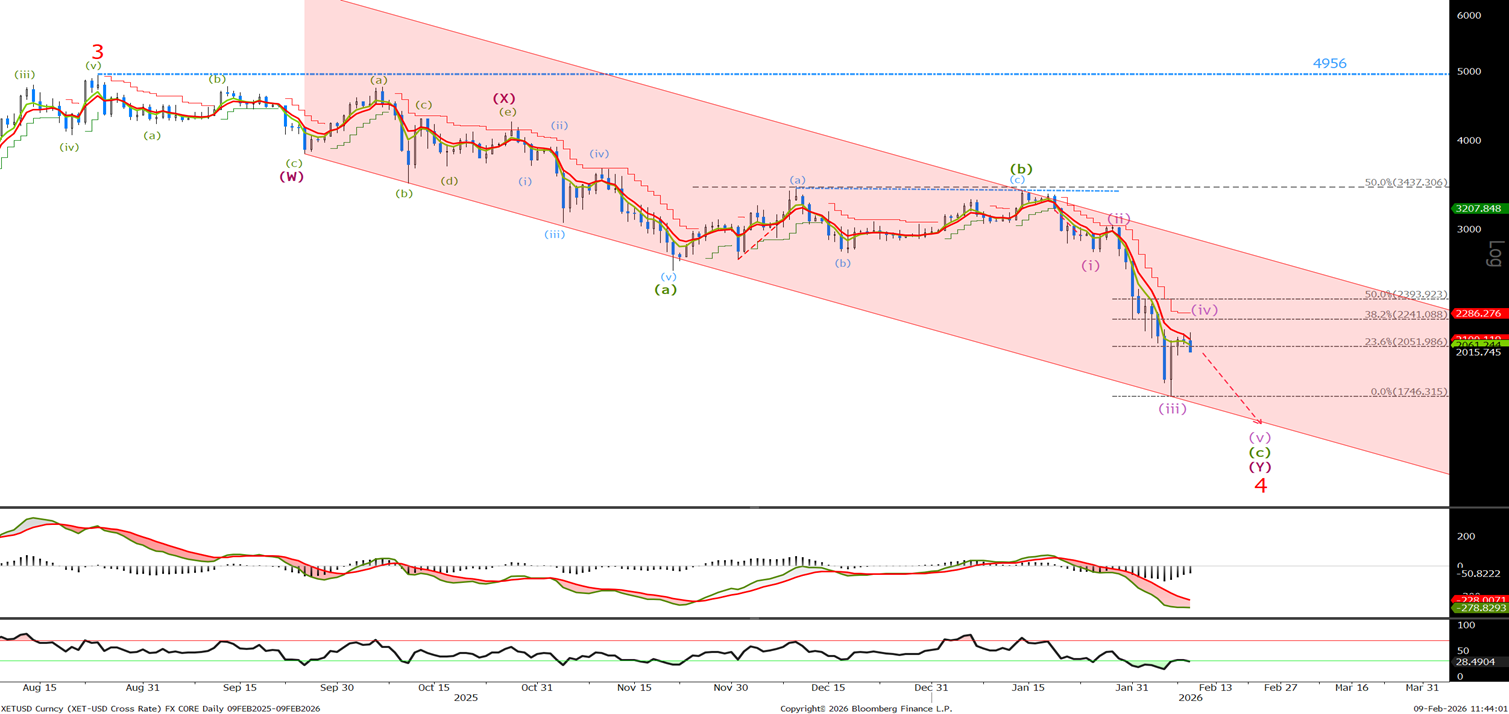
ETH broke lower and accelerated down to 1746 before correcting back this morning to a high of 2150. I am showing wave (iv) as complete but we do not rule out another push higher to test the 2241 or 2393 level. Whilst below 2784 we continue to look for a final 5 waves to new lows before a low is in place.
Ethereum Short Term Chart
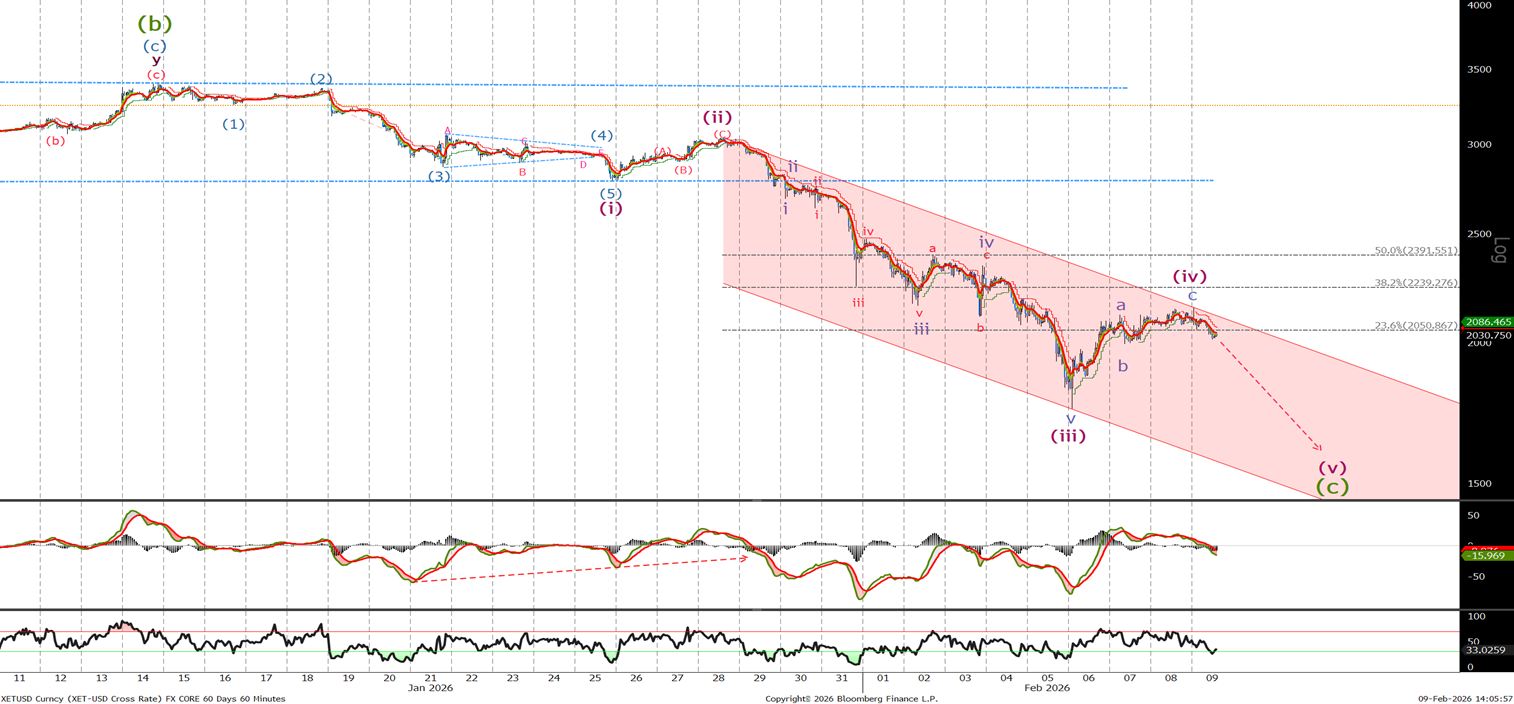
Last time I said ‘We traded to 3036 enabling us to sell and since then we have sold off in 3 waves. Looking at the divergence in the MACD we expect another leg higher towards the 2480-2520 area before the sell off resumes. A move back above 2800 would negate this current view.’ We just traded lower, never getting the chance to add to our shorts . I am selling now with stops above 2800 for a test towards the 1500-1630 level.
