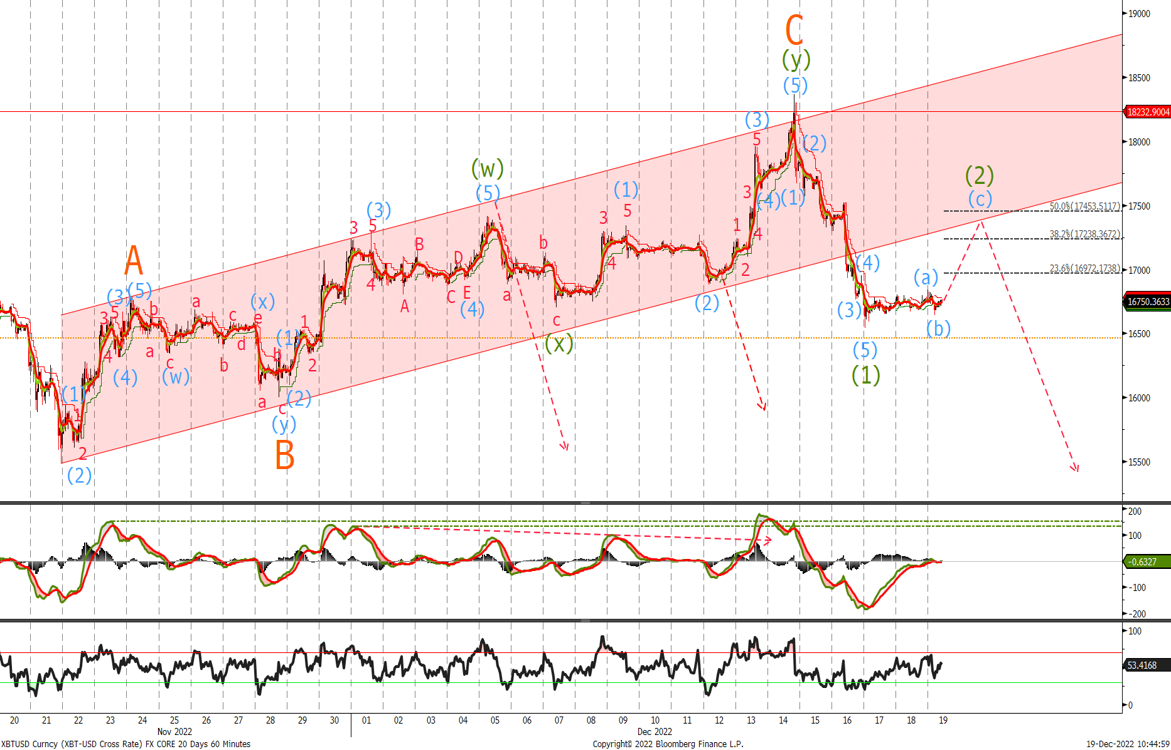
Bitcoin
Last time we said:
‘If the bearish view is valid then a correction in 3 waves is close to completing with a possible push to $17'530 which would test the top of the channel as well as the 161.8% retracement level. Given the divergence in the MACD we expect a top to be in place soon with a close below the $15'995 level indicating what should be the final leg lower to new lows’
We slightly overshot the topside targets and top of the channel but the break out and close below the uptrend channel adds weight to the argument that the correction is over. Look to sell retracement into the $16'975 / $17'450 area with stops above last weeks lows for an acceleration to the downside and a move below $15'000.
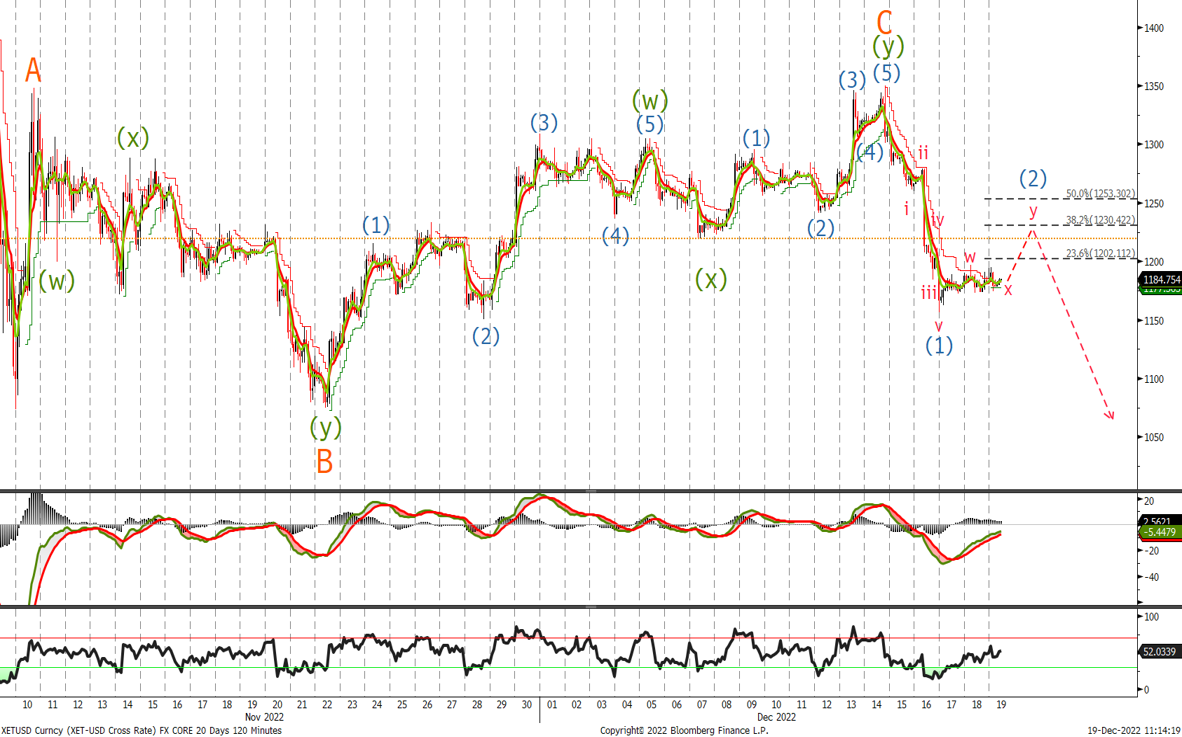
Ethereum
Last time I was showing a bullish chart and said:
'A close above $1'350 on a daily basis will confirm that the next leg higher is underway. Until then given the set up for divergence in the MACD stay on alert for a possible sell off with a close below wave (2) at $1'150 indicating another sell off ahead’
The high was $1'347 and the low $1'156. Given the speed of the sell off I am favouring the downside whilst below last week's high. Look to sell in the $1'230/$1'255 area with a close below $1'150 confirming wave 3 lower.