
Bitcoin
Last time we showed the long term chart and said that
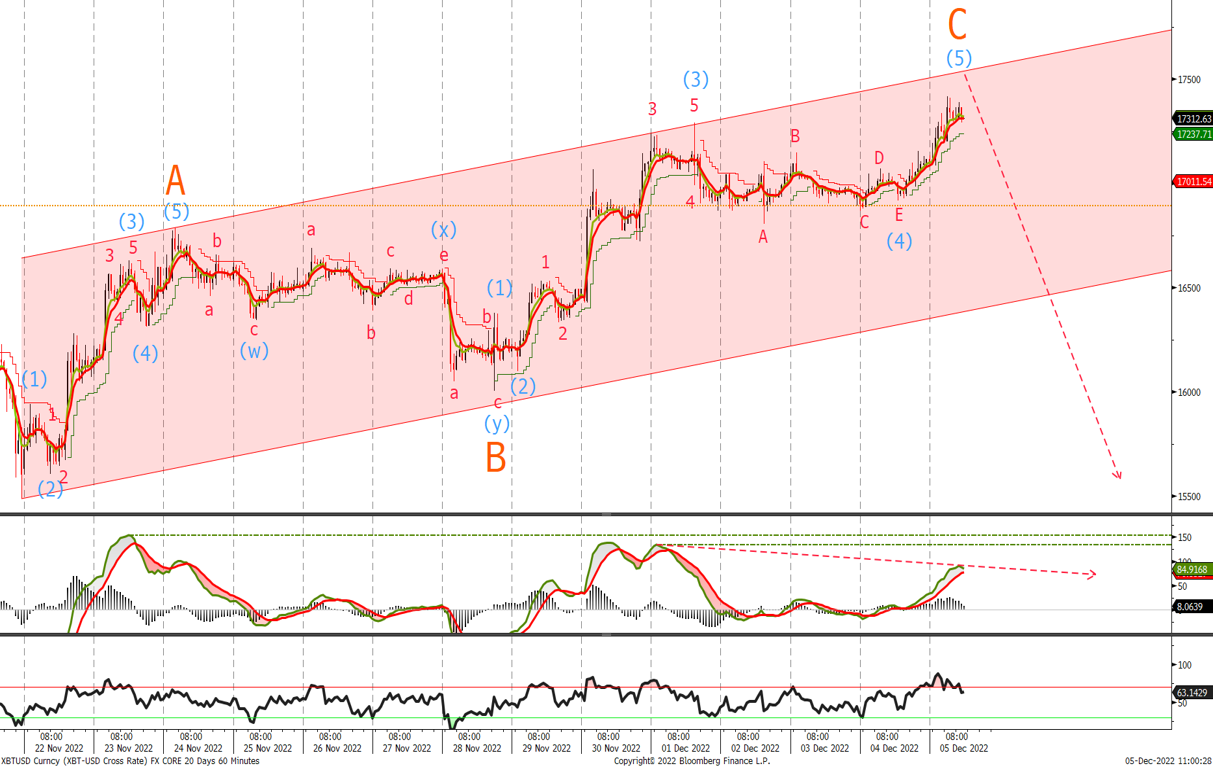
‘A move back above 18140 would now be the first indication a low is in place followed by a daily close above 19400’
If the bearish view is valid then a correction in 3 waves is close to completing with a possible push to 17530 which would test the top of the channel as well as the 161.8% retracement level. Given the divergence in the MACD we expect a top to be in place soon with a close below the 15995 level indicating what should be the final leg lower to new lows. Remain bearish using last weeks topside levels for the bullish view.
Ethereum
Last time we said
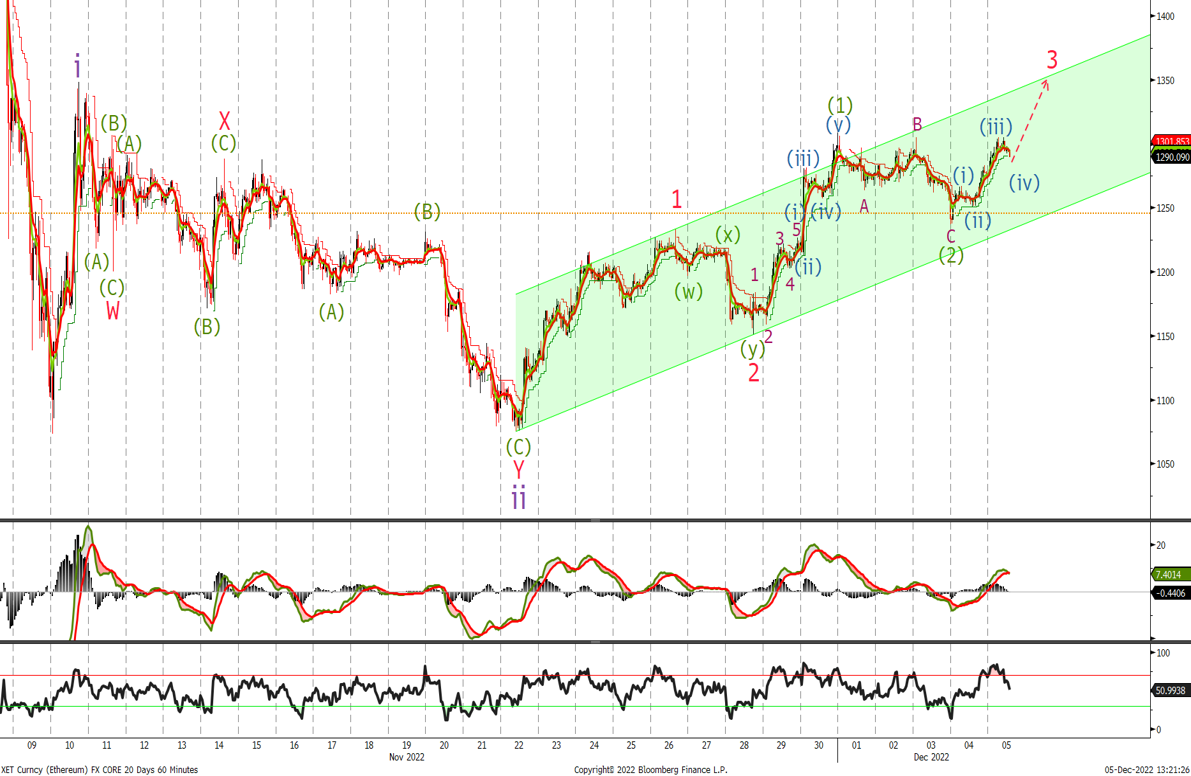
‘A move up through 1293 should see an acceleration to the topside with initial targets at 1522. Look to buy at 1155 with stops below 1070.’
We traded to 1152 enabling us to get long. We have broken the 1293 reaching highs at 1308 , 1305 and 1304. I was expecting a burst up though these levels so that fact we have a triple top does put me on alert , that like BTC maybe we have simply seen a 3 wave correction in a larger triangle correction. A close above 1350 on a daily basis will confirm that the next leg higher is underway. Until then given the set up for divergence in the MACD stay on alert for a possible sell off with a close below wave (2) at 1150 indicating another sell off ahead.
