Bitcoin Weekly Chart
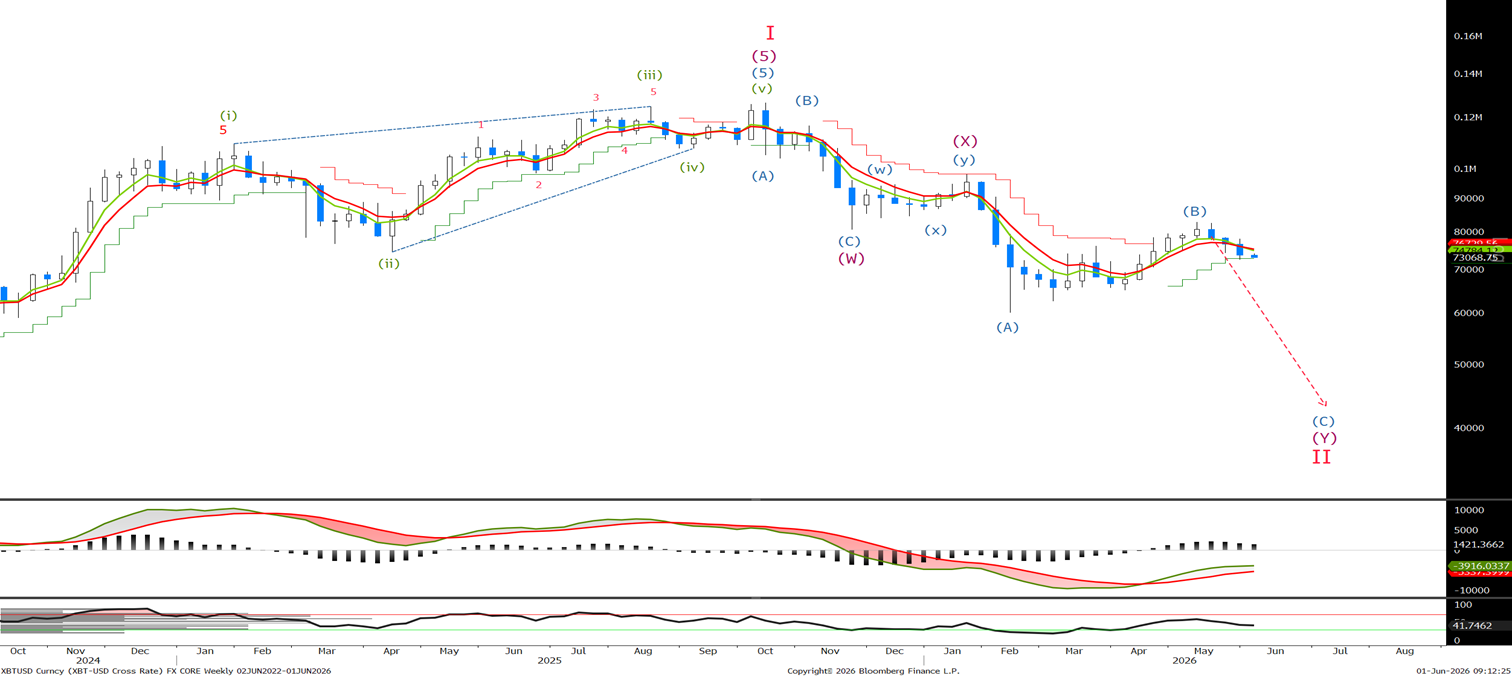
We remain bearish for the BTC and I have left the arrow unchanged on a weekly basis, lets look to the short term charts as we continue to look for BTC to trade below 60k.
Bitcoin Daily Chart
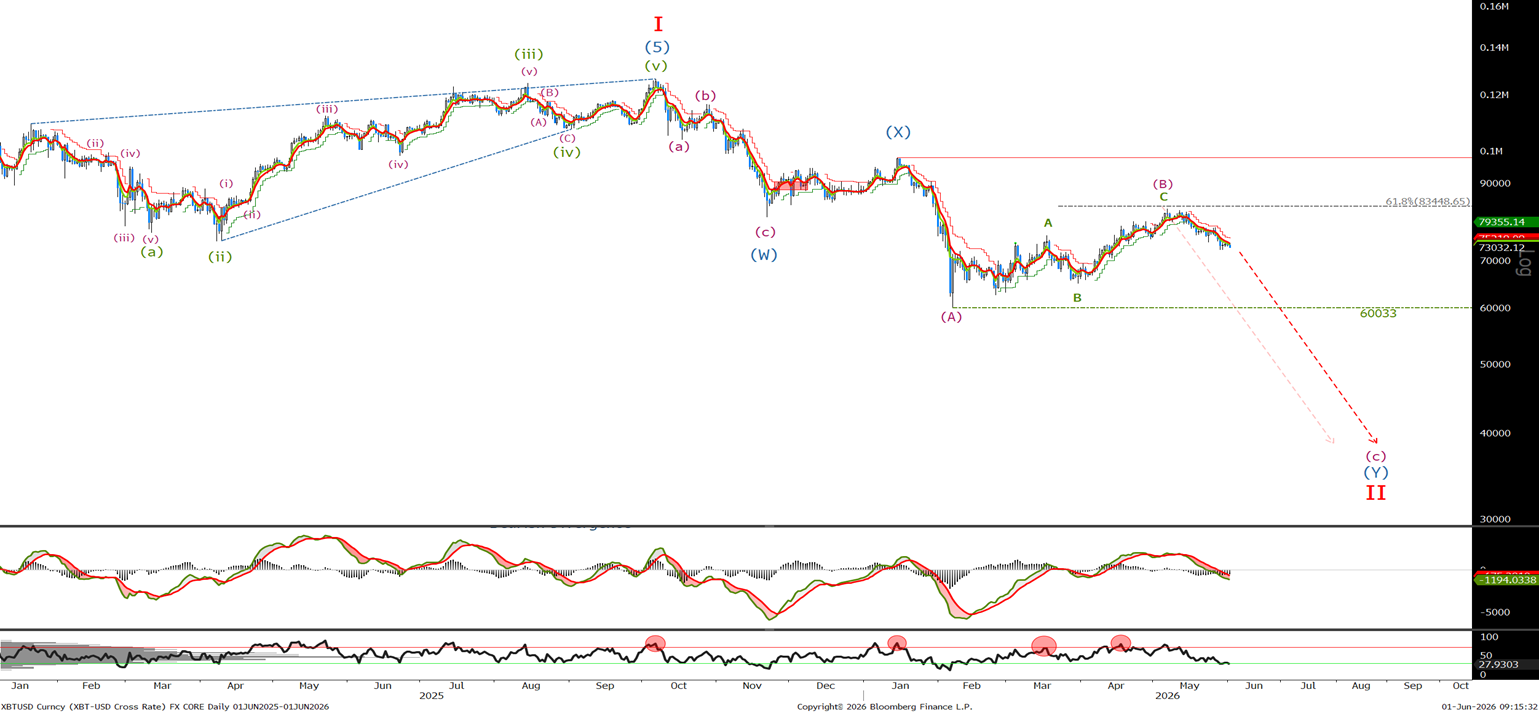
As you can see we have corrected in a clear 3 wave pattern off the wave (A) low a6 60033 and on a daily basis whilst below the 83.5K level I will remain bearish. We have dropped around 6.5% since last weeks update and I would use any retracements to sell into with stops above the wave (B) high.
Bitcoin Short Term Chart
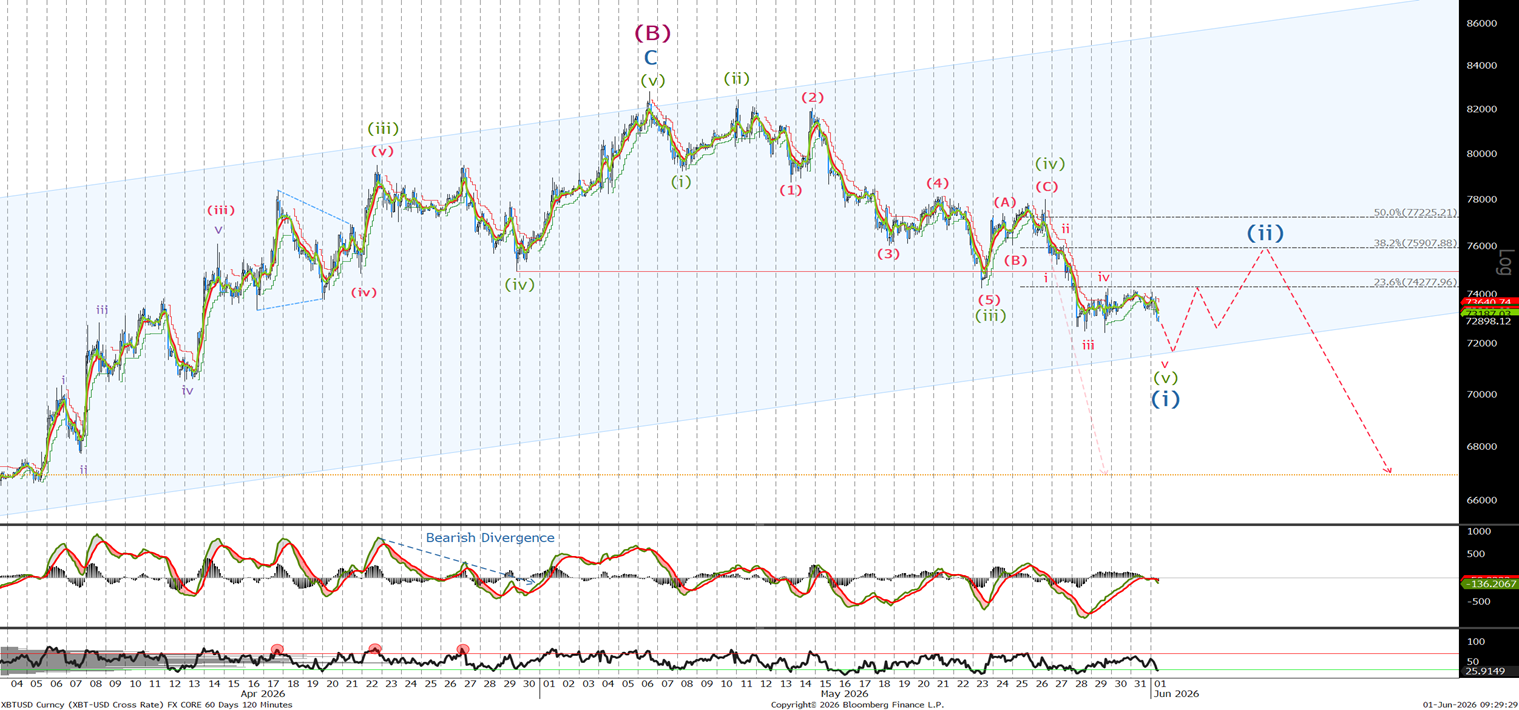
Last time I said 'I am selling now at 77k with stops above this month's high at 82807’. We traded up to 77.9K to complete the minor wave (iv) correction. This should be followed by a 5-wave sell-off, and it appears we have one slight new low towards the bottom of the channel at 71.6K. I am reducing my short position and will look to add to the remaining shorts at 74.3K and add it to 75.9K with stops now lowered to last week's highs at 77.9K
Ethereum Long Term Chart
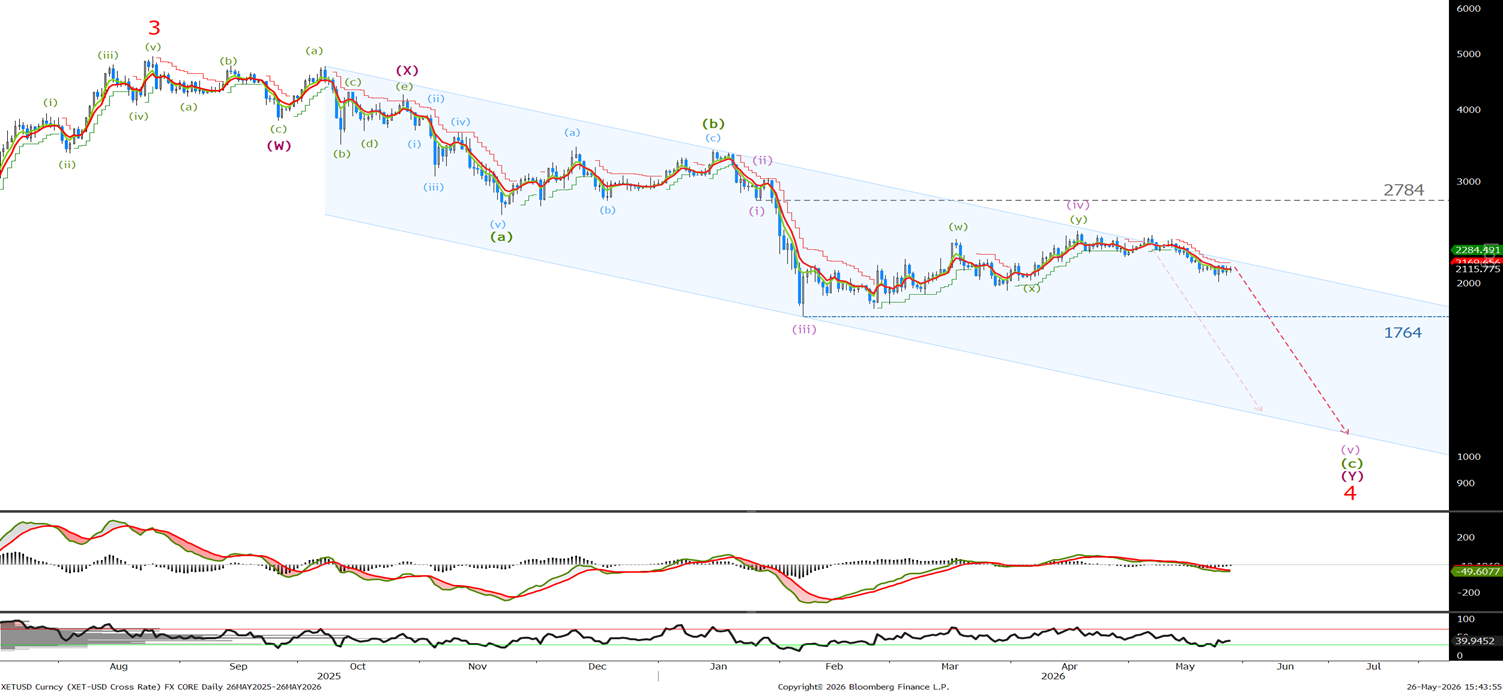
Last time we said, ‘I am happy to sell now as we test the top of the channel at 2085 with stops above 2784. Expect an acceleration lower on a break of 1746.’ As you can see, there is no change in the view as we continue to trade lower. We need to trade below 1746 to complete 5 waves down. In the shorter term, we can lower stops to 2500, and I would start reducing my position below 1746.
Ethereum Short Term Chart
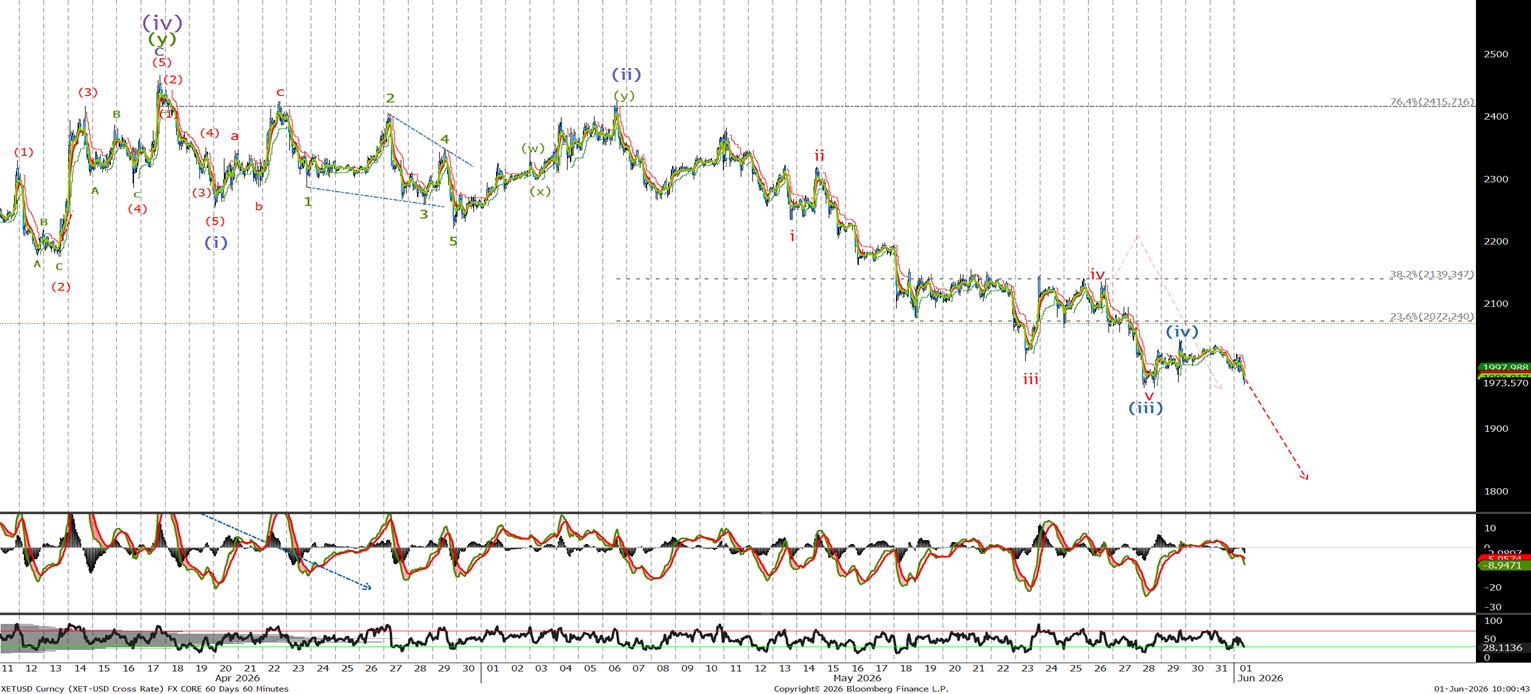
Last time we said ‘The low so far is 2007 and, if not short, look to sell at 2165 and again at 2215 with stops above 2380.’ The high was 2140 before selling off and, like the BTC, we need to make a new low below 1964 to complete 5 waves, look to reduce shorts below there. Once in place, we will have a better idea of possible levels to resell, but until then we remain bearish in the short term.
