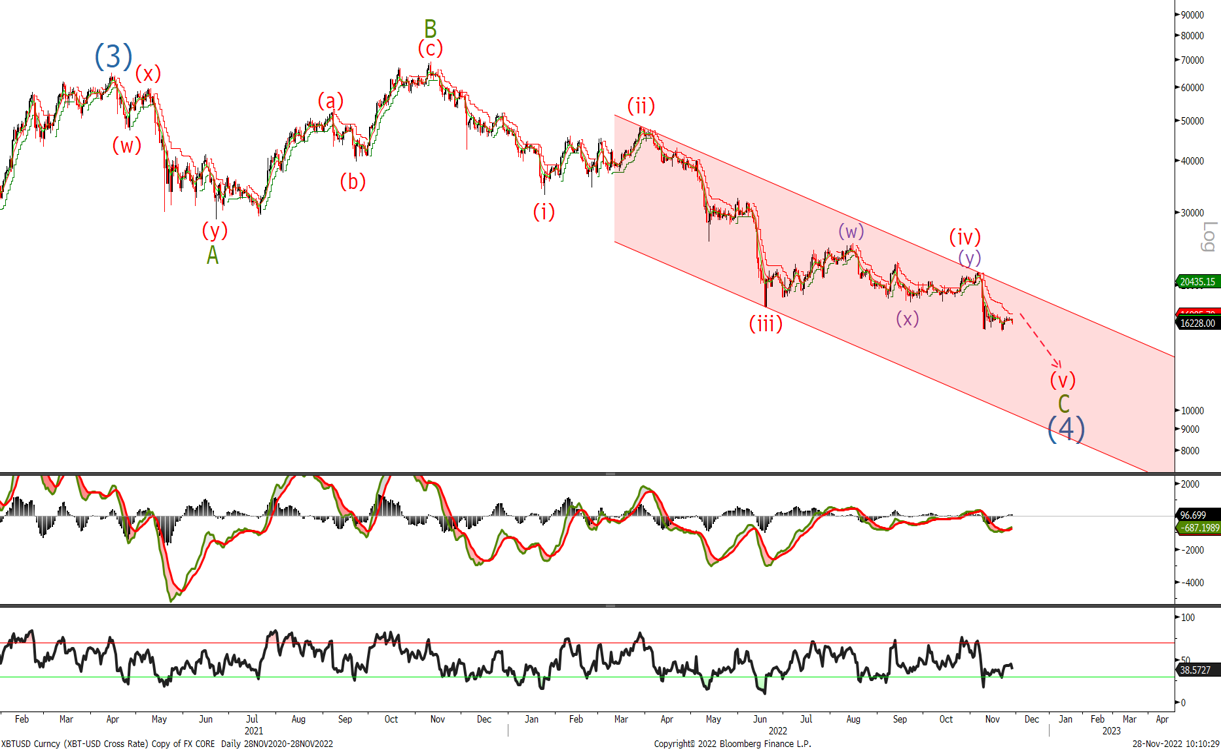
Bitcoin
I am showing the long term chart for BTC today. As mentioned last week:
‘wave iv often appears as triangles with an impulsive break to the down side targeting $15'060 followed by $13'430. A move back above $18'140 would now be the first indication a low is in place followed by a daily close above $19'400’
So far the low has been $15'485 and it is possible that we have seen the end of low (4) but until we have a daily close above $18'140, I will remain on the lookout for a new low towards the $13'430 level. A move above $17'150 is now the first indication that BTC has bottomed.
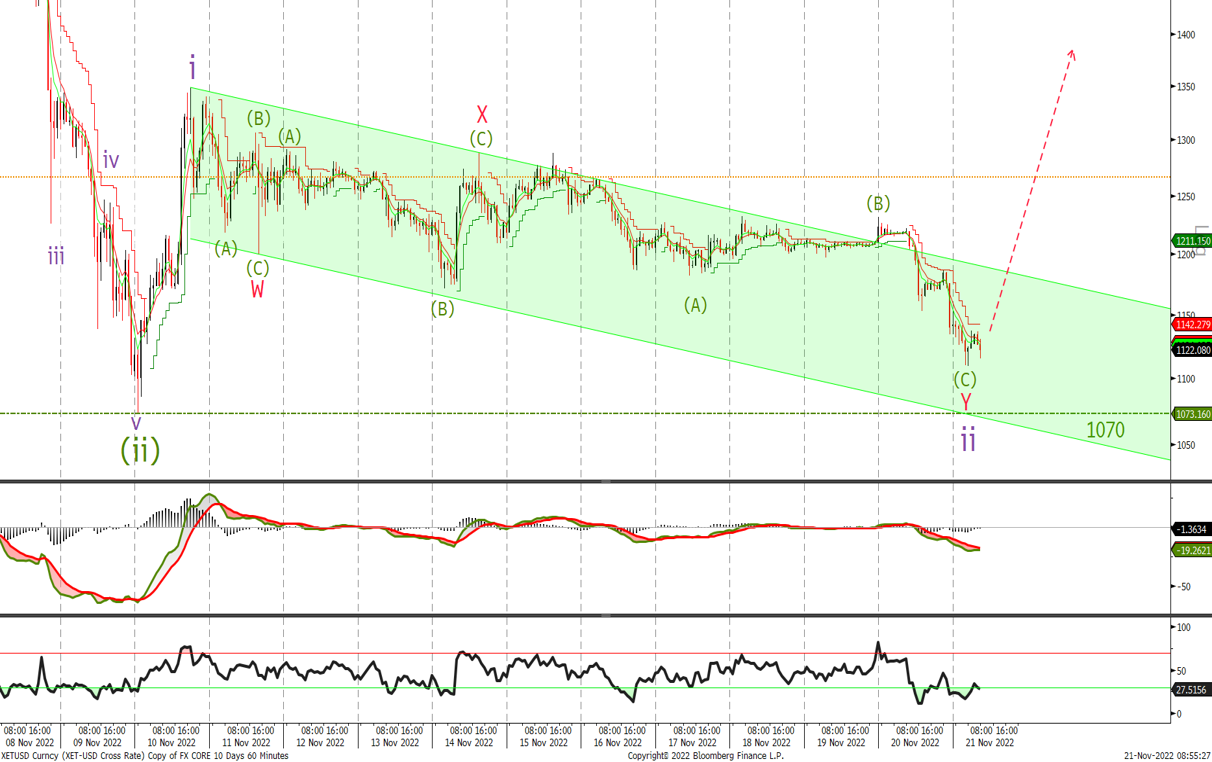
Ethereum
Last time we said:
‘It appears that we are close to completing the wave ii correction. Any move below last weeks low $1'070 should end above $880 and use that level as a line in the sand for the bullish view. If we do selloff then look to buy at the $1'000 level with stops below $880.’
A move up through $1'293 should see an acceleration to the topside with initial targets at $1'522. Look to buy at $1'155 with stops below $1'070.