Bitcoin
As mentioned last week:
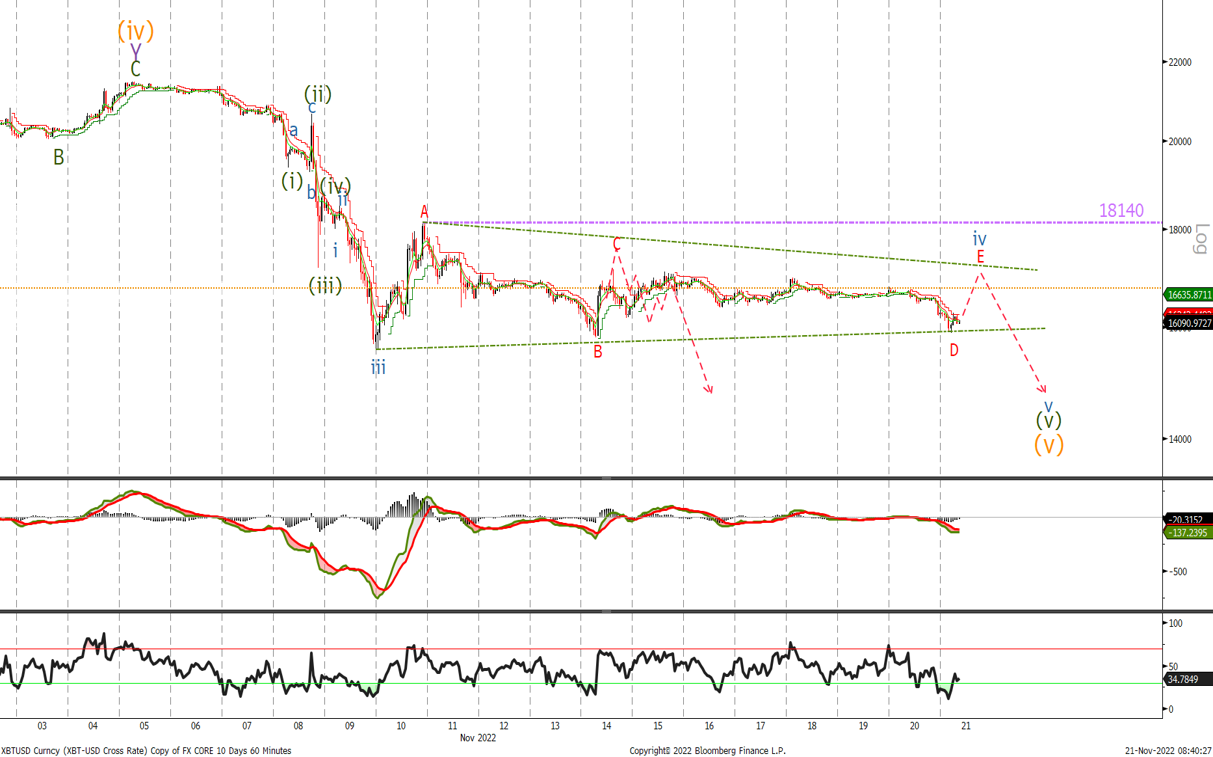
‘I think we will continue to see BTC under pressure for a final push to new lows to complete 5 waves down. A move back above $19'400 will confirm a low is in place. Initial support comes in at $15'060 where wave (v) is equal to wave (i)’
No change in our view as BTC traded sideways in the corrective triangle shown last week. As mentioned in the past, wave iv often appear as triangles, with an impulsive break to the down side targeting $15'060 followed by $13'430. A move back above $18'140 would now be the first indication a low is in place followed by a daily close above $19'400.
Ethereum
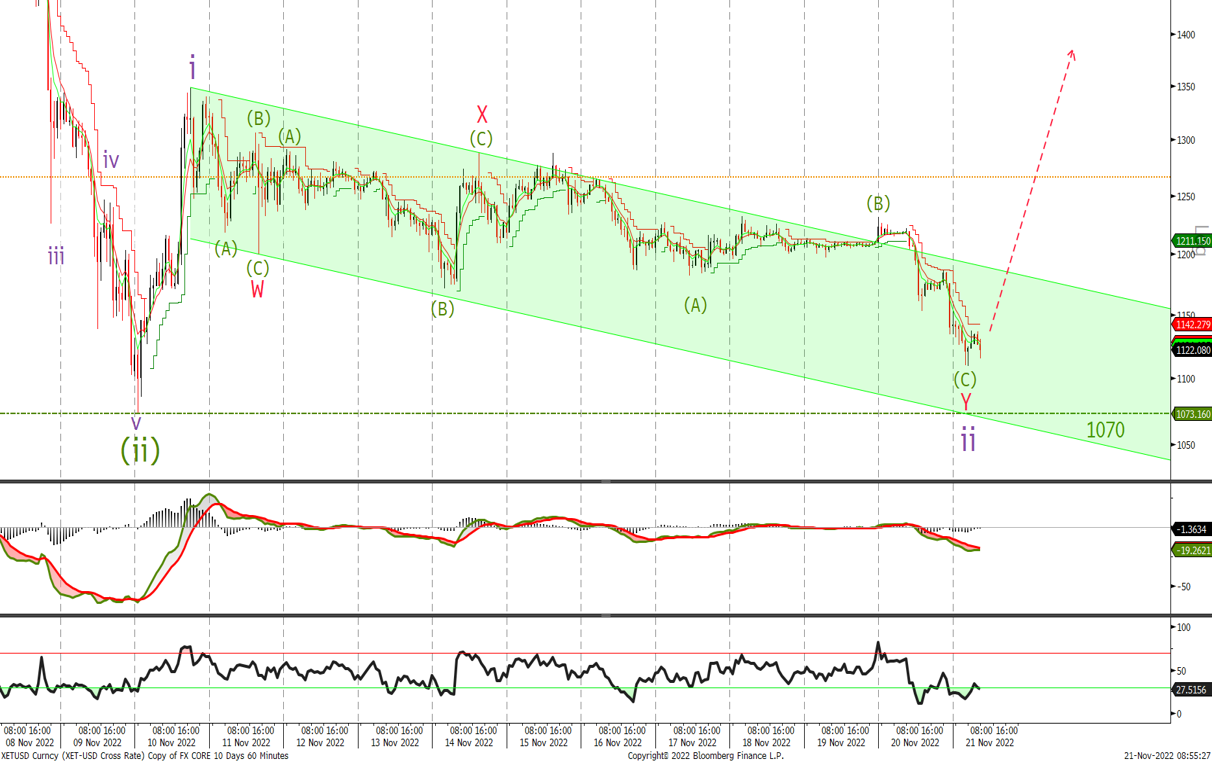
Showing the short term chart this week. Last time we said:
‘Short term I can count 5 waves lower so it appears that the sell off may have completed wave Y of wave (ii). Any move below last weeks low should end above $880 and use that level as a line in the sand for the bullish view. If we do sell then look to buy at the $1'000 level with stops below $880’
It appears that we are close to completing the wave ii correction with the levels mentioned last week remaining valid.