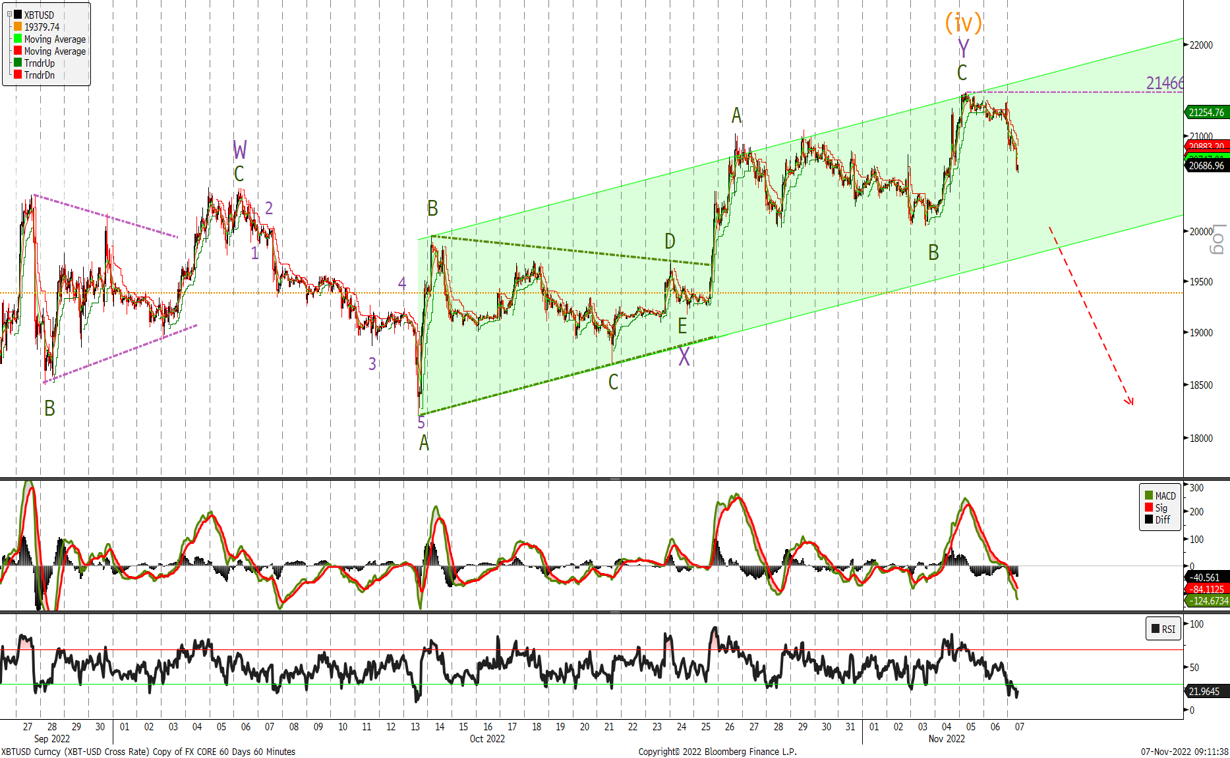
Bitcoin
As mentioned last week I will:
‘remain bearish on BTC and whilst below $25'220 I will keep this view’
I have gone back to the hourly chart to show the possible completion of wave (iv) at the last run up to $21'466. A break of that level will mean that the last run up is only wave 1, but wave W is equal to wave Y in length at $21'480, so we almost have equality. A break below $20'045 and the bottom of the channel will confirm that new lows are expected in the weeks ahead and place stops above the wave (iv) high.
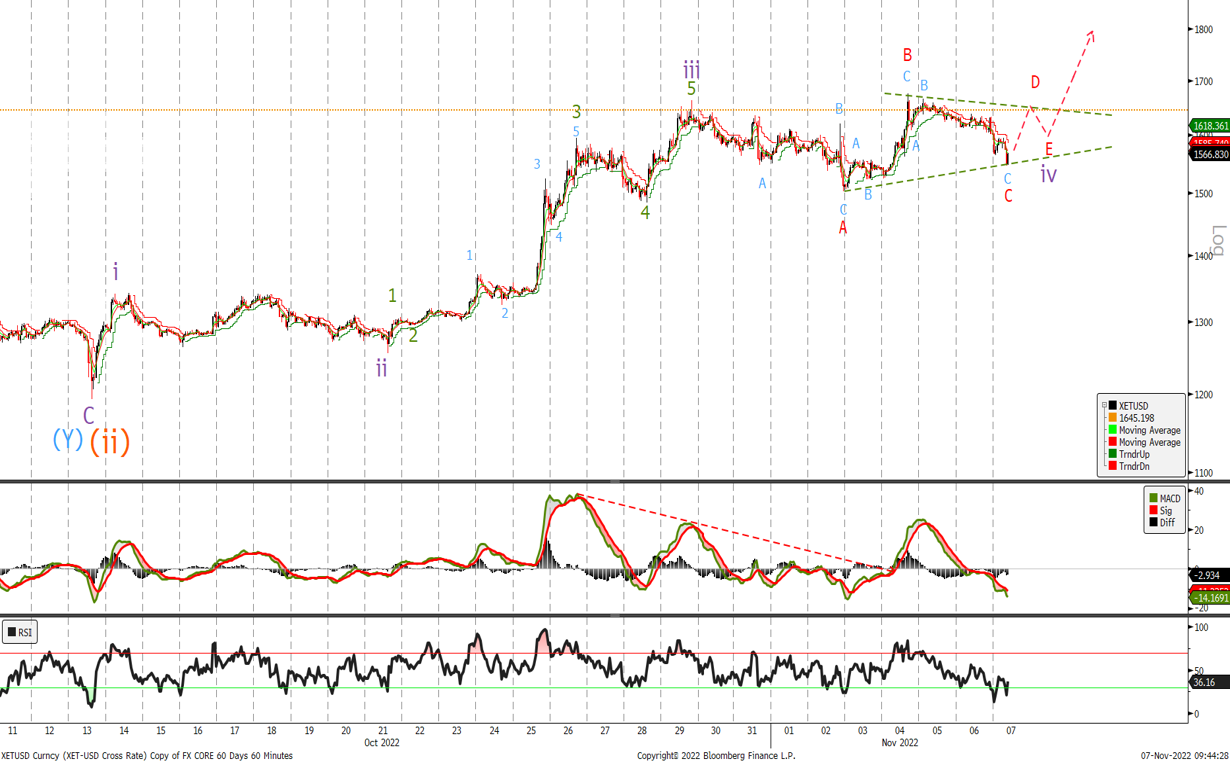
Ether
Last time we said:
Use any pullback into the $1'481-$1540 area to buy ETH with stops below $1'325. The divergence in the MACD indicates that wave iii may soon be over once a new high is made. So look for a 3 wave correction in wave iv to buy at the above levels
The low we saw was $1'502 and since then rather than a 3 wave correction, it looks as if we are tracing out a triangle for wave iv. Leave stops at $1'325 with a break out of the triangle targeting at least $1'800 on the topside.