Bitcoin
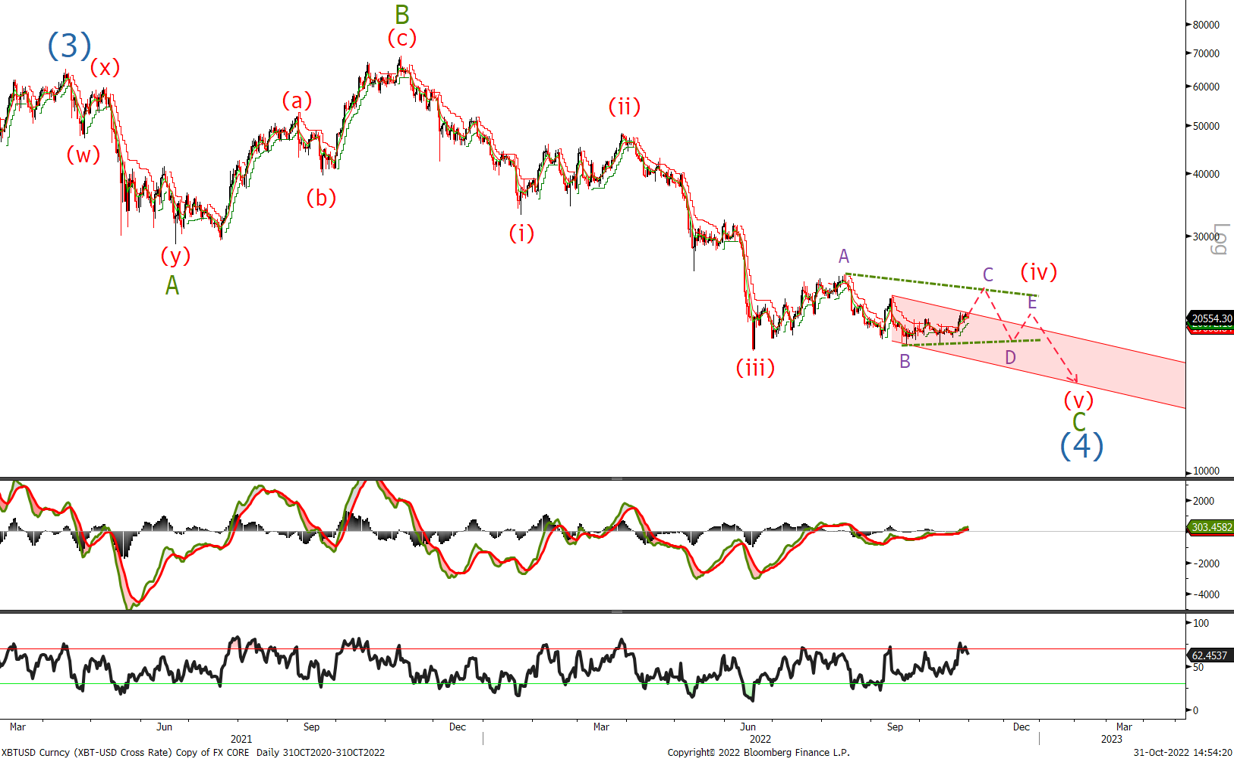
People have asked why I remain bearish on BTC and whilst below $25'220 I will remain with this view. I am showing a logarithmic daily chart to emphasis the fact that until we break the above level, on a purely technical analysis basis it looks as if we are tracing out a wave (4) corrective triangle. With no sign of divergence in the MACD , often an indicator of the end of a trend , I still prefer to play the downside
Ethereum
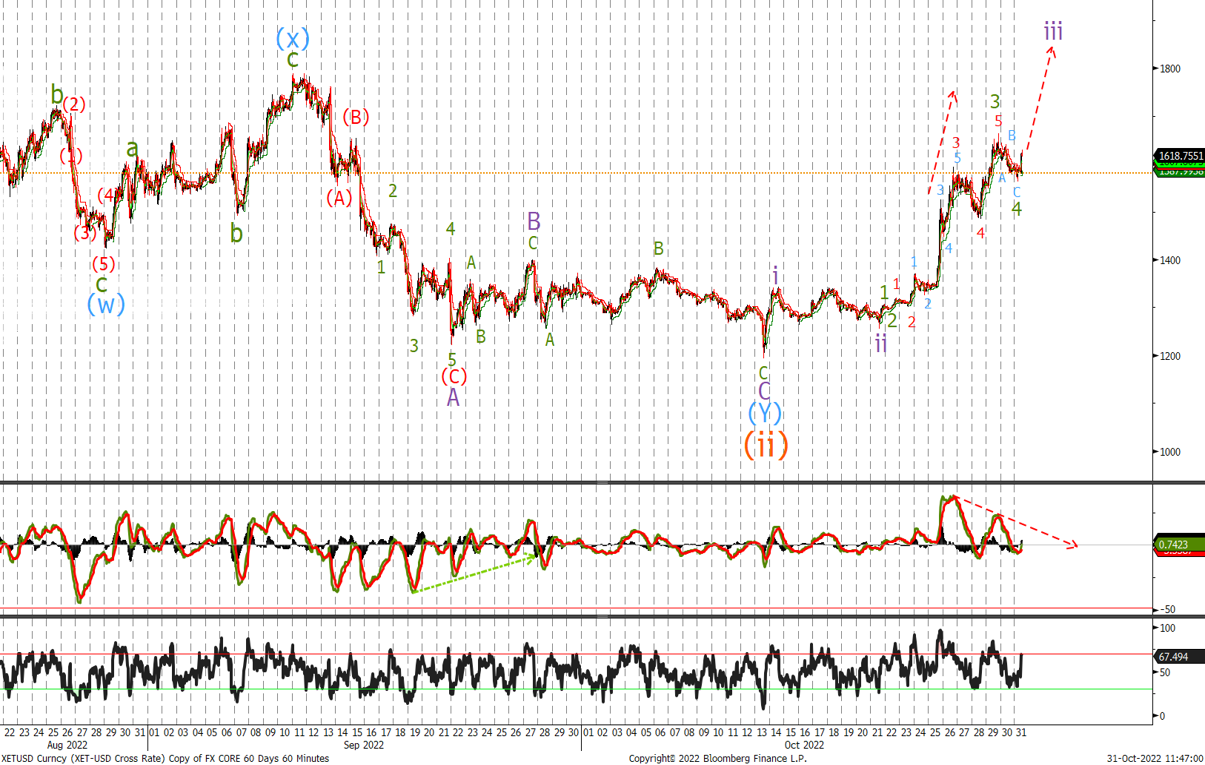
In the quick update last Wednesday we said:
If correct we should see the ETH accelerate quickly to the topside, with next target once $1'565 broken, a break above $1'800 level
The high so far is $1'668 and I am looking for a new high above that to complete wave iii. Use any pullback into the $1'481-$1'540 area to buy ETH with stops below $1'325. The divergence in the MACD indicates that wave iii may soon be over once a new high is made. So look for a 3 wave correction in wave iv to buy at the above levels.