
Bitcoin
We said that wave (iv) had completed last week , but the subsequent price action indicates that a larger zigzag correction is underway. Look for a move up towards the 20500/21000 area where we would sell with stops remaining at 22800.
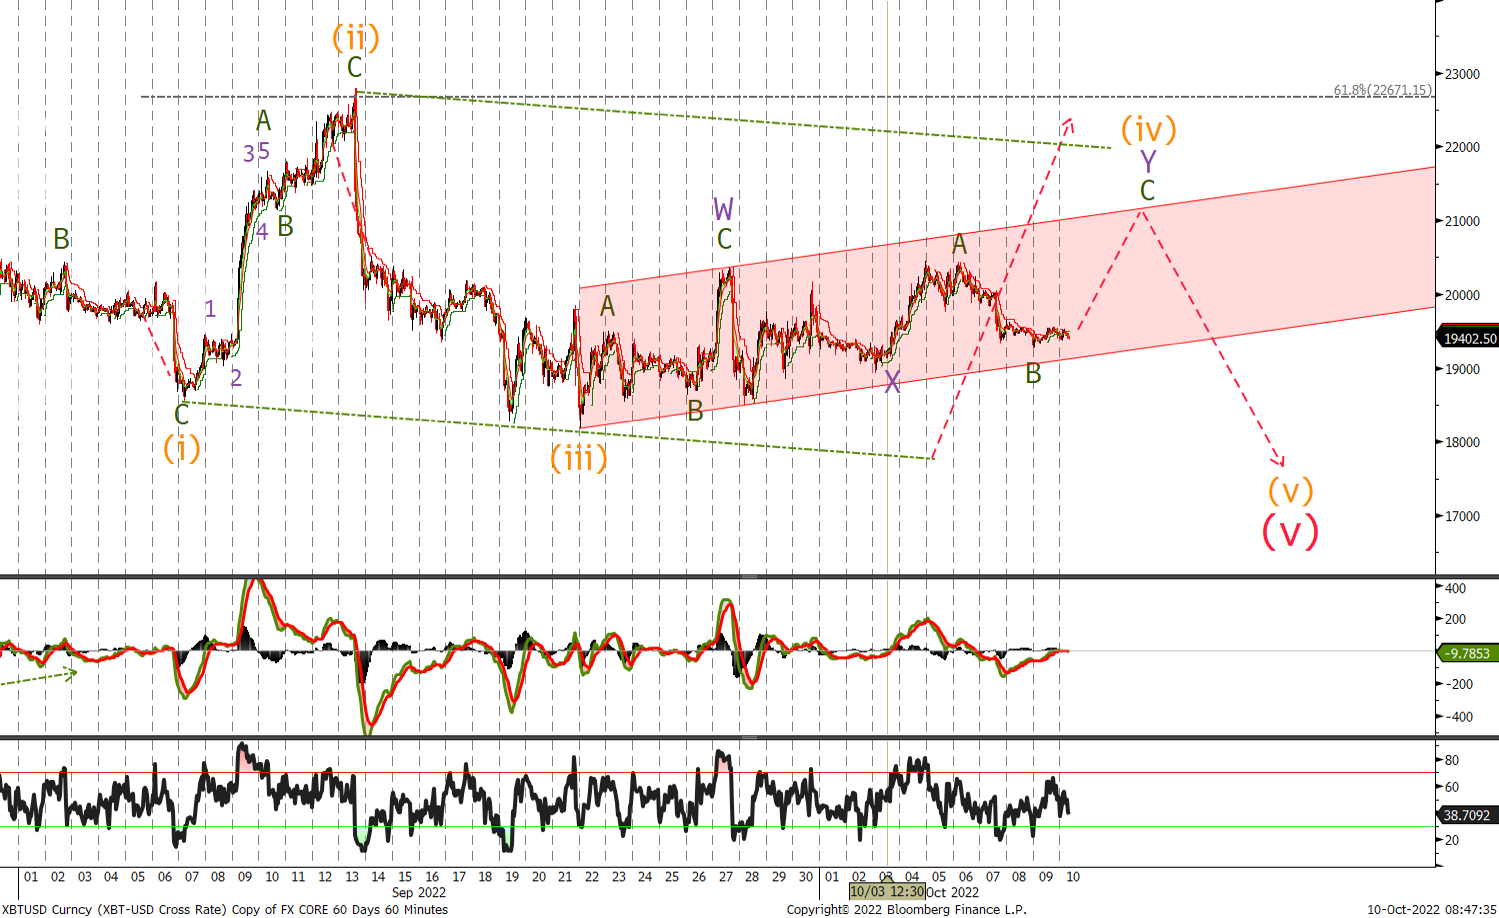
We still expect a drop in the BTC to new yearly lows to end the correction off the yearly highs. However a move back above 22800 will be the first indication a low is in place.
Ethereum
In the last update we said ‘remain bearish for a new low towards the bottom of the channel. Wave (y) will equal wave (w) at 1180 so start reducing shorts around that level and I would look to go long at the bottom of the channel currently at 1100.’
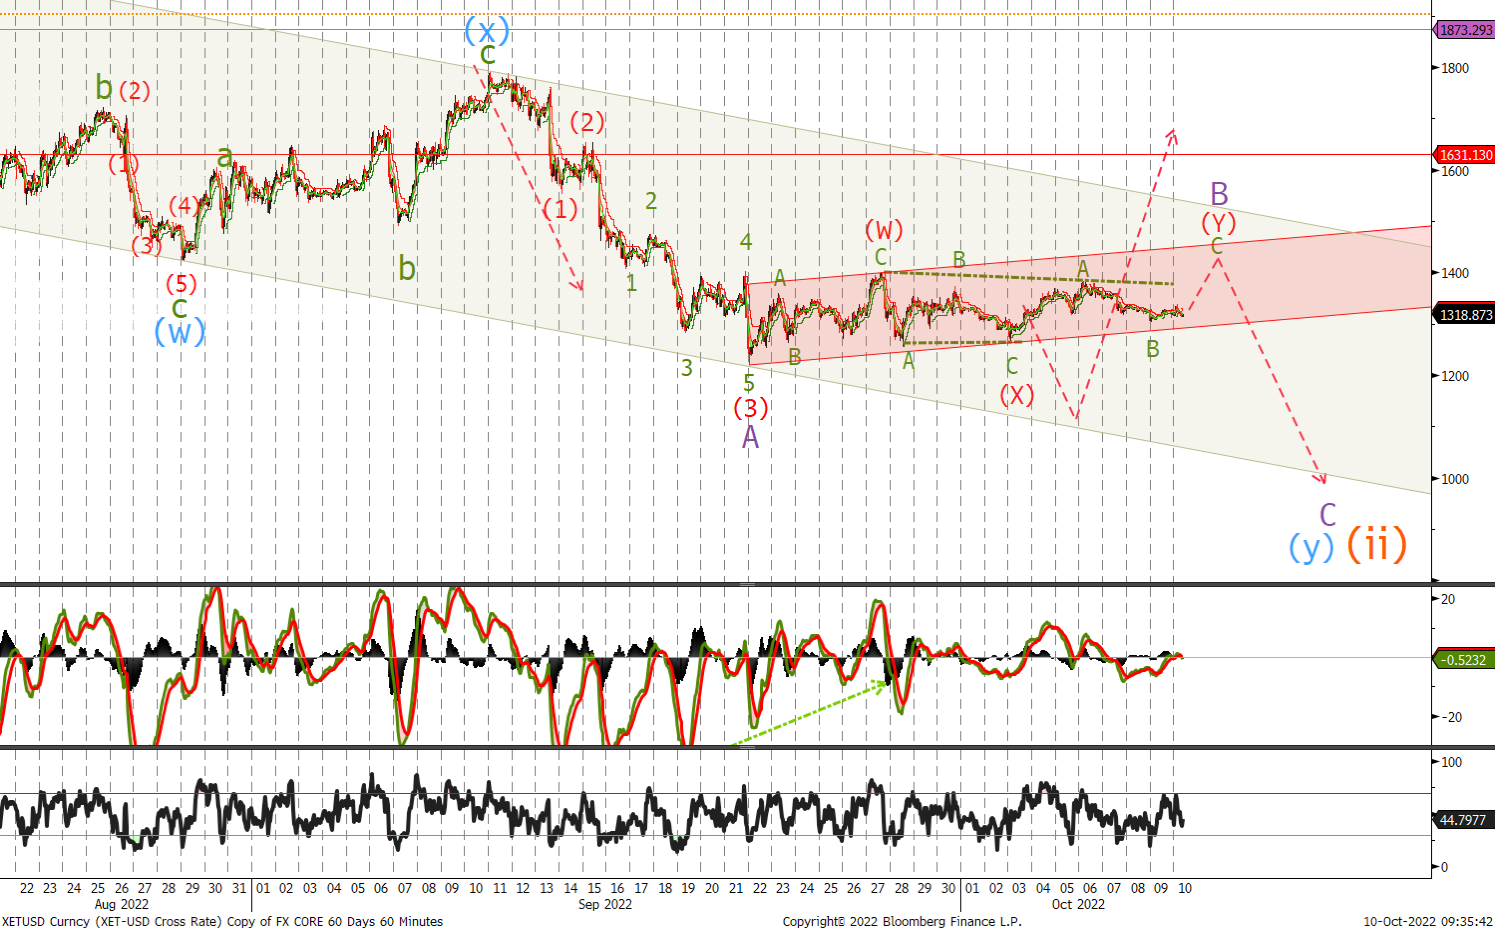
A little early calling the sell off and I have changed the wave count to show a larger zigzag correction playing out. Look to sell in the 1480/1555 area stops at 1660. A break below 1300 should see an acceleration lower and I would buy now in the 1000/1100 range.
