Bitcoin Weekly Chart
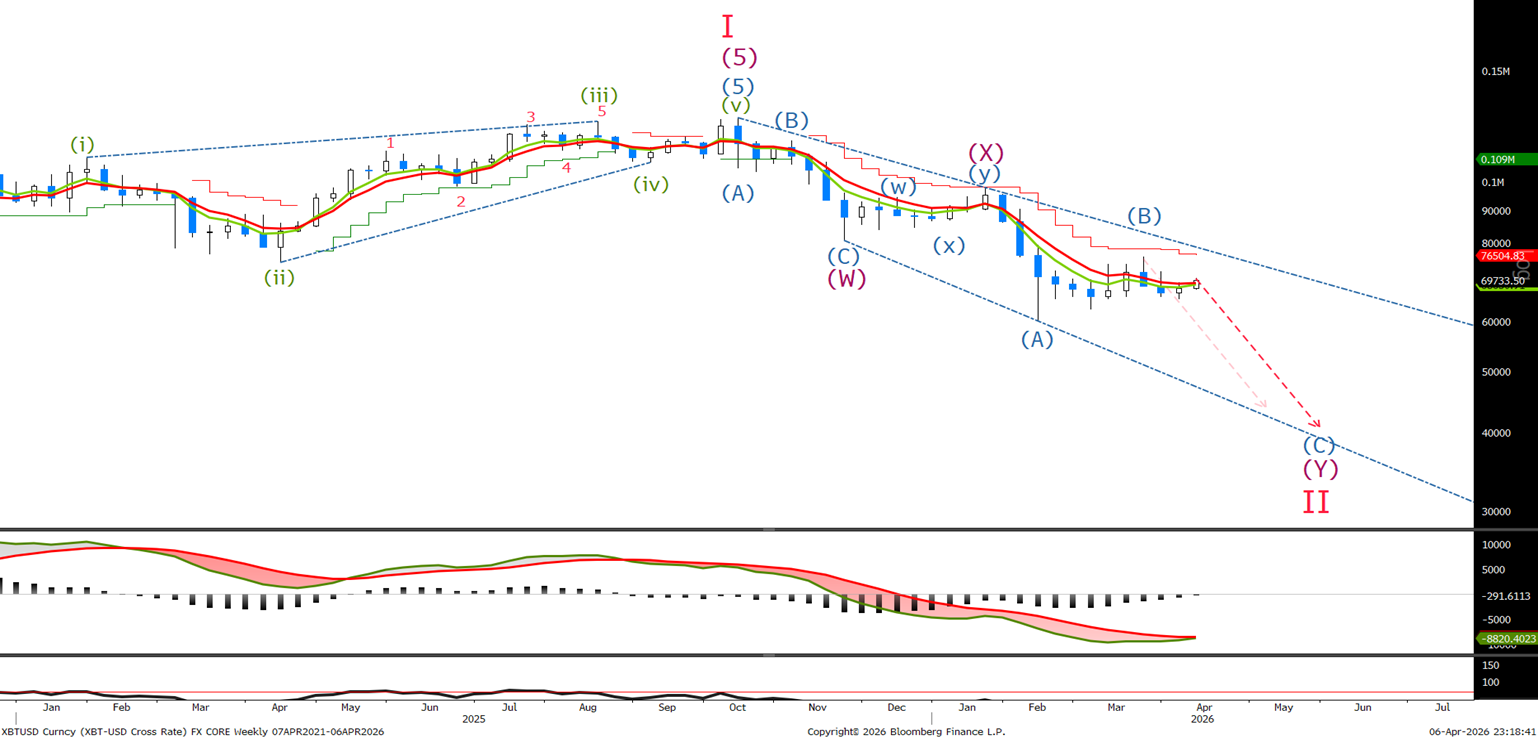
On a weekly basis we continue to look for lower whilst below the wave (X) high, Lets look to the shorter term to see how far along wave (C) we are.
Bitcoin Daily Chart
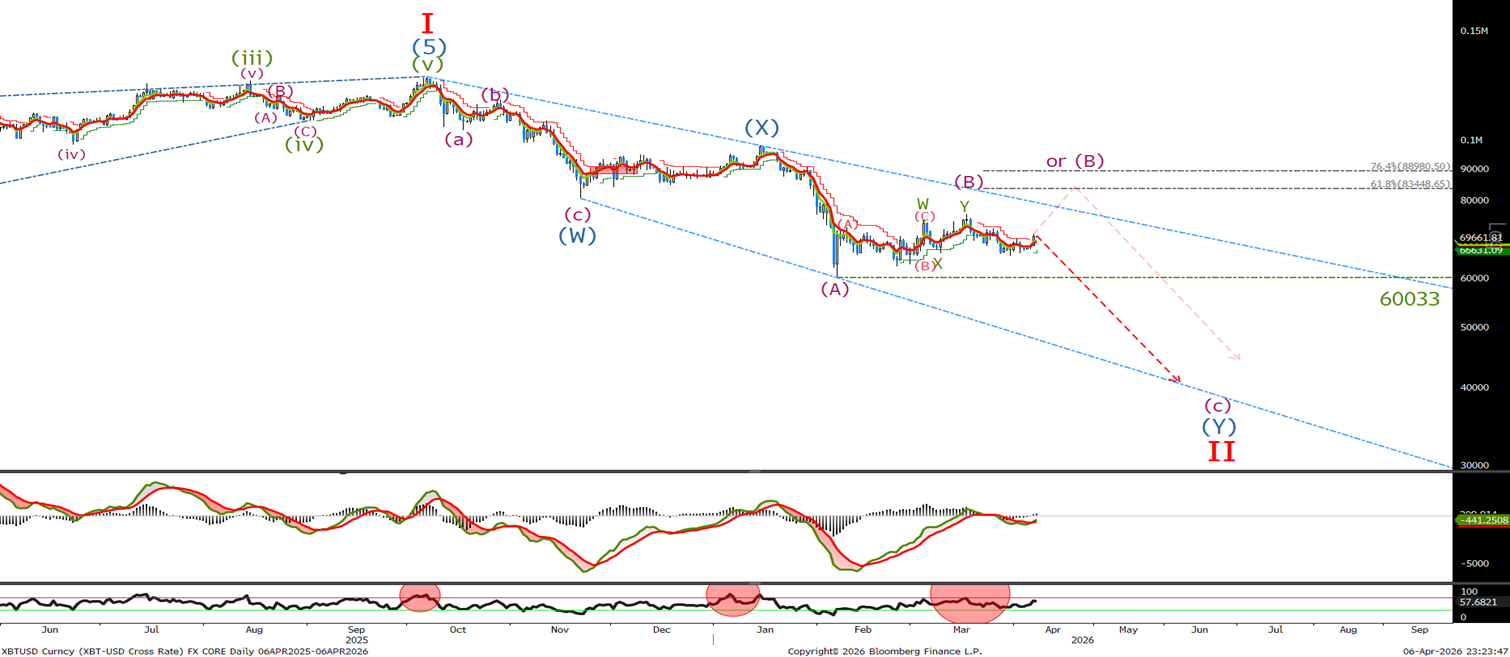
Last week we said, ‘The daily chart shows the slight new high for wave Y completed wave (B), and we should now sell off in 5 waves to complete the larger wave II correction. Expect an acceleration on a break below the wave (a) low at 60033.’ It appears we may have completed the first wave lower, so let's look to the short term for possible sell levels. I am showing the alternative view as well, which will come into play on a break above, what I believe is the wave (B) high at the moment. If we do trade higher from here, I will use that opportunity to sell around the top of the channel followed by the retracement levels shown on the chart.
Bitcoin Short Term Chart
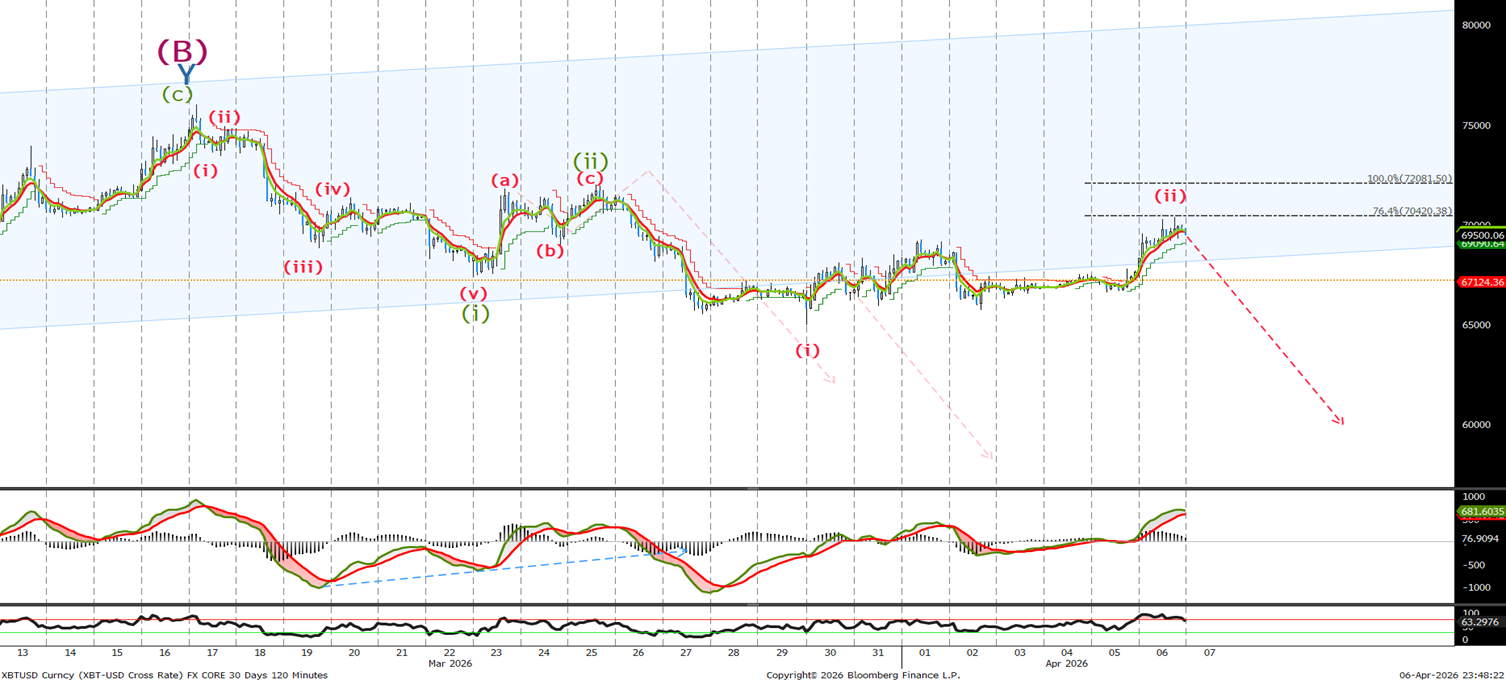
Last time we said ‘ that the sell-off and the breaking of the channel should be the completion of wave (i). We have since corrected in 3 waves to complete wave (ii) and I expect to see a sharp sell-off any time now to below 60033.’ The correction actually traded higher, falling just shy of the 76.4% retrace level at 70481. I am happy to sell now with stops above 72015. A break below 65600 should now see an acceleration lower.
Bitcoin 30 Minute Chart
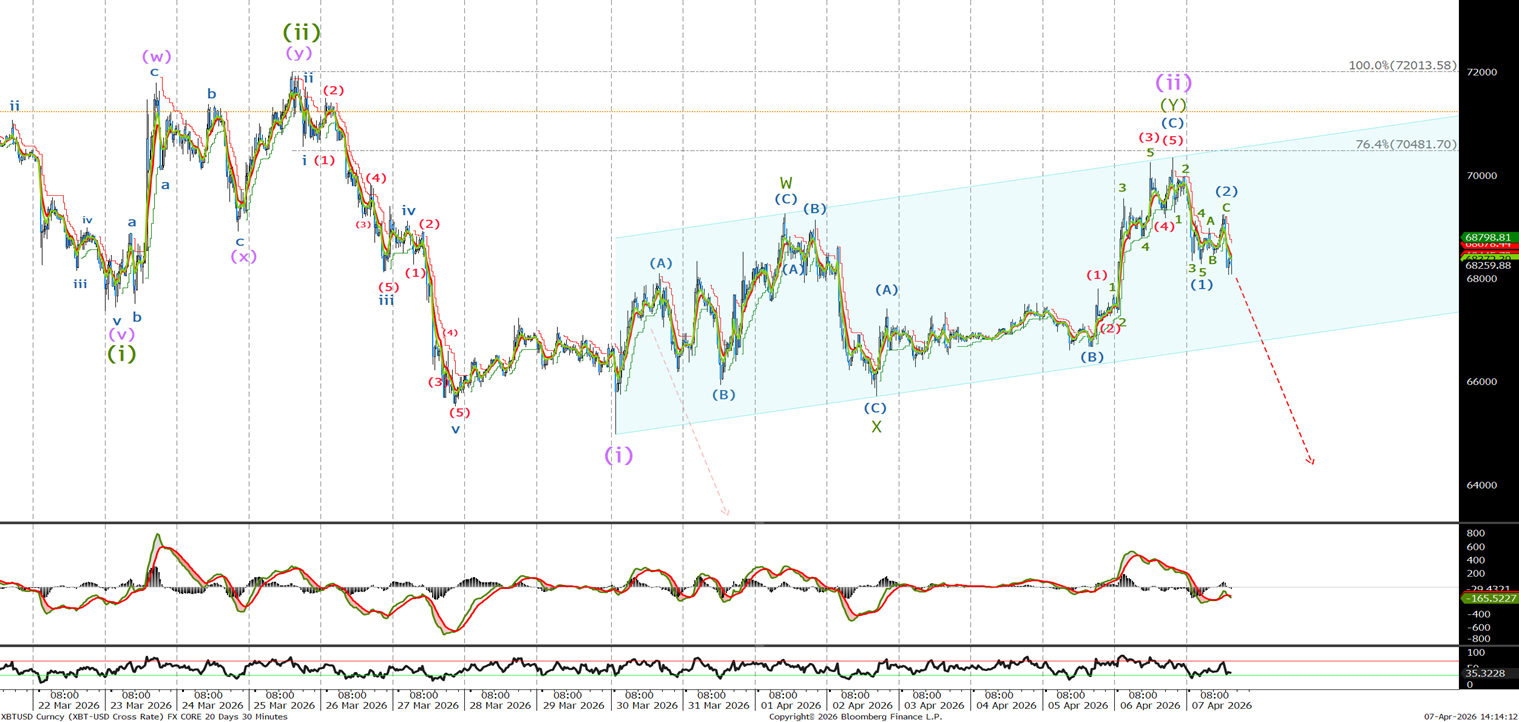
Last time we said ‘If wave (ii) hasn’t ended then look to sell at 68002 and again at 68768 with stops now at 72020.’ We traded to 70350 reaching the top of the channel and just shy of the 70481. If not short then sell now at 68800 and leaving stops at 72020.
Ethereum Long Term Chart
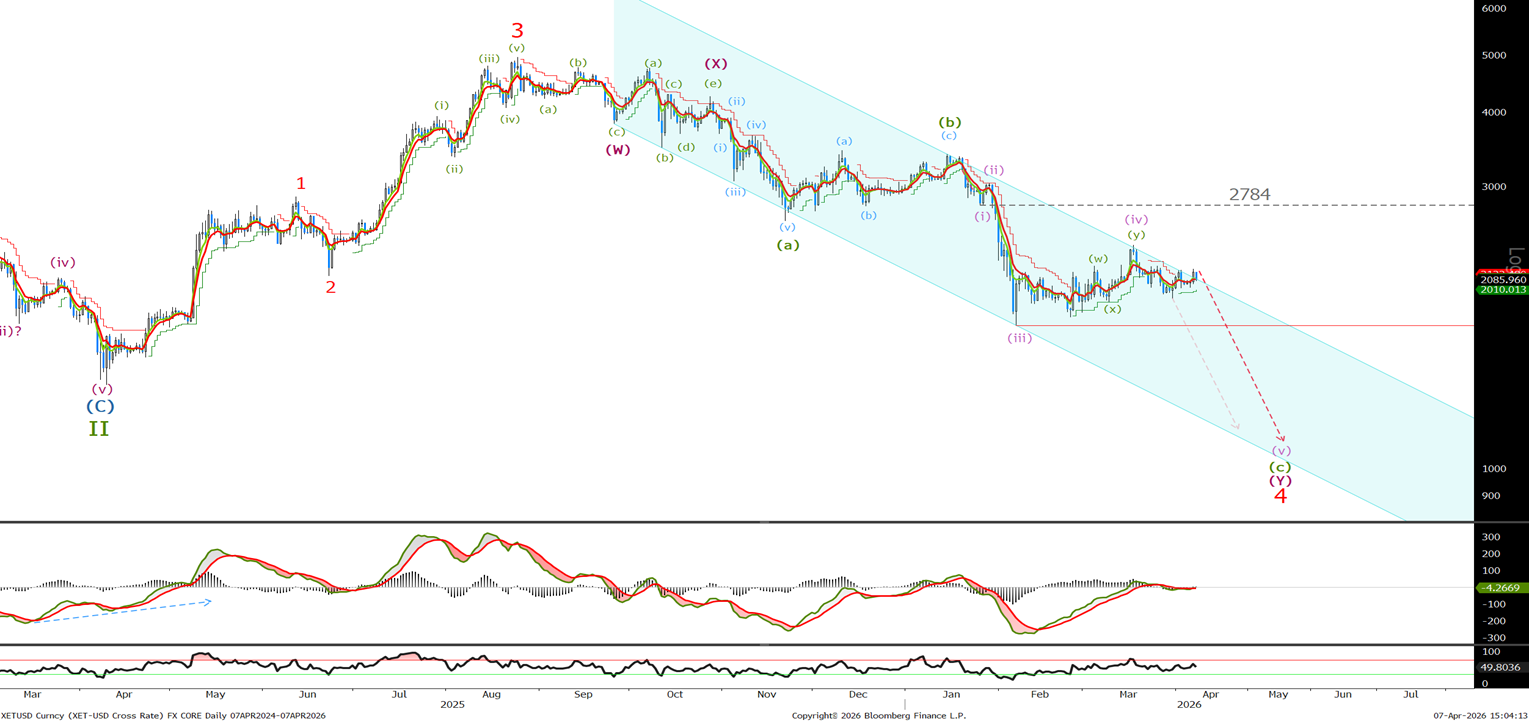
Nothing has changed in the daily ETH as we continue to look for lower in the coming days. It appears we have traded back in 3 waves (which we will see in the next chart) and I am happy to sell now as we test the top of the channel at 2085 with stops above 2784. Expect an acceleration lower on a break of 1746.
Ethereum Short Term Chart
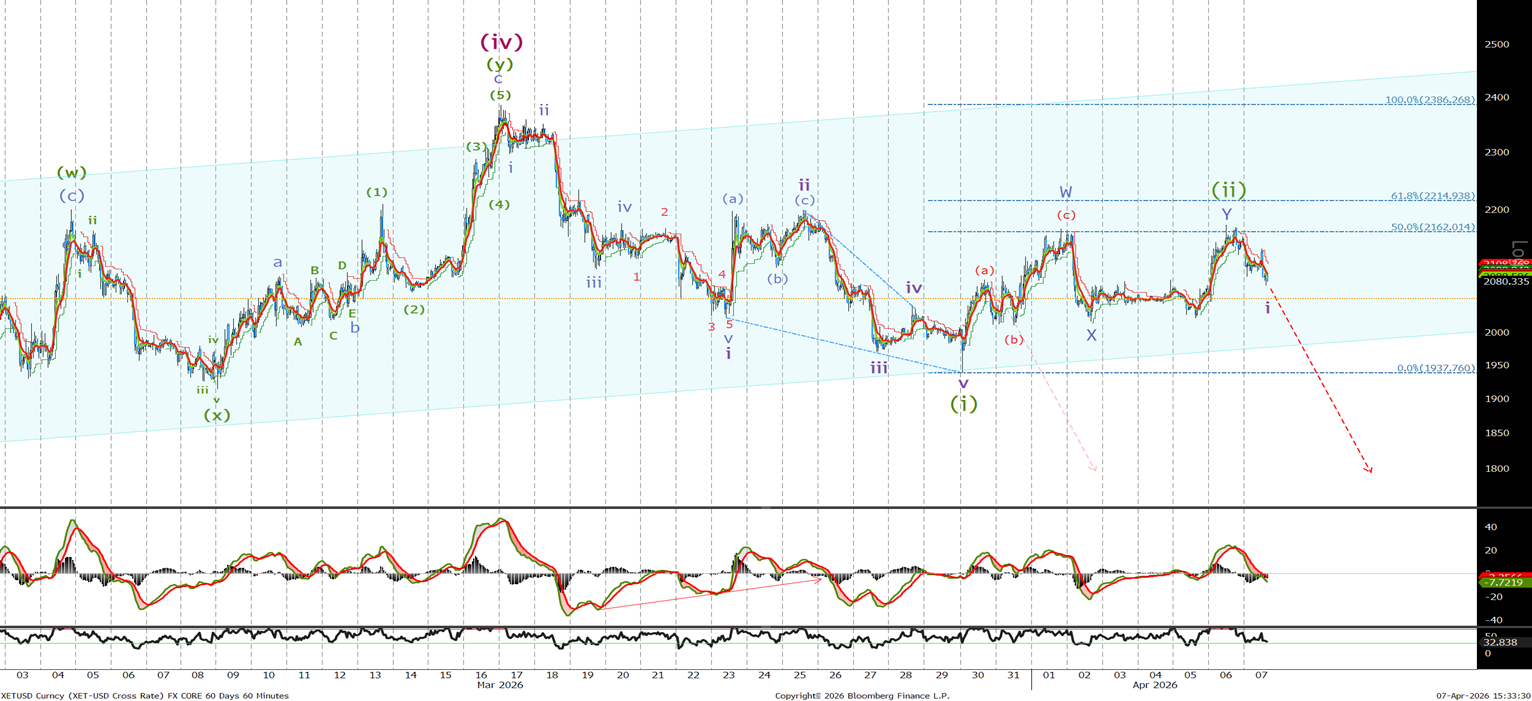
Last time I said ‘We are currently correcting in wave (c) of wave ii. We have just hit the 50% retracement level at 2083. Sell now and again at 2110 with stops above last week's high at 2210. Look for an acceleration to the downside on a break of last week's lows at 1937 and a close below the blue channel.' We traded to 2167, then down to 2067 before trading higher again to complete a zigzag correction and then end of wave (ii). If not short sell now with stops remaining at 2210.
