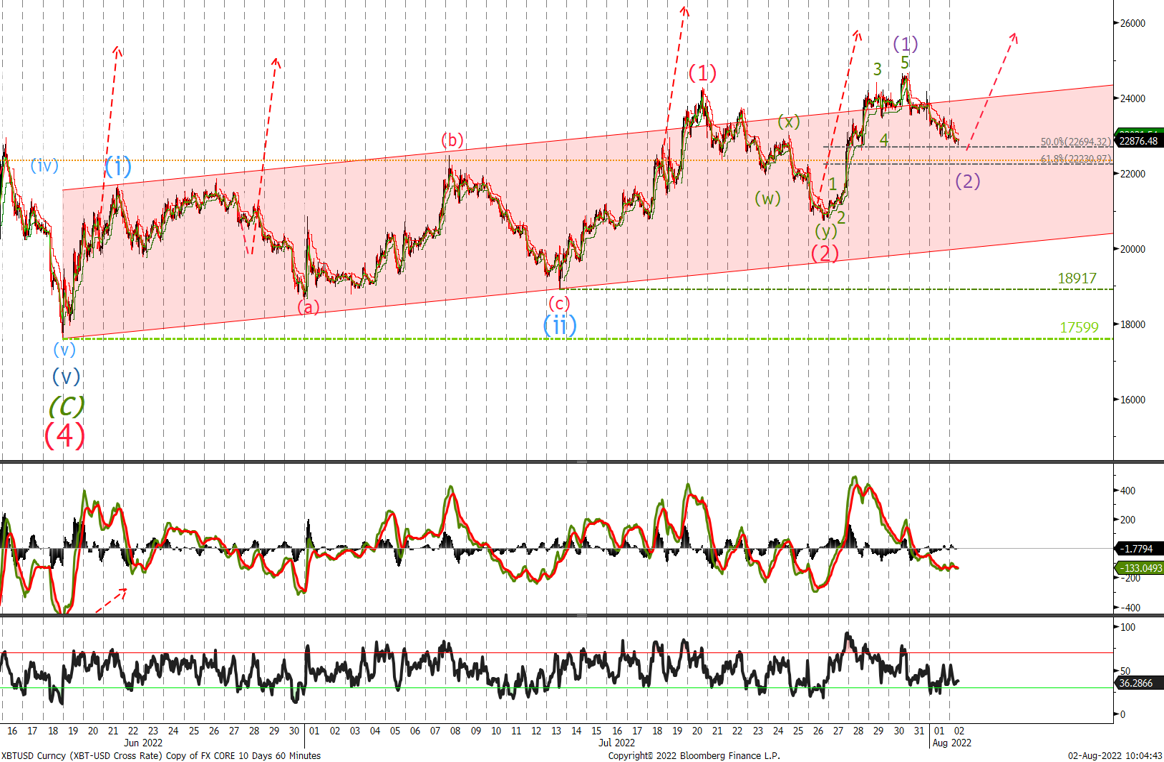
Bitcoin
Last time we said:
‘I think we can trade a little lower to complete wave (y) with a push down into the $20'960 - $20'182 area where we would be looking to add to longs with stops remaining at last week's levels’
We traded down to $20'730 enabling us to buy. If correct then we could see BTC trade slightly lower to complete minor wave (2) into the $22'200 / $22'700 area.
Add to longs on this pull back. Cut half the position at $20'700 and raise the stop loss on the remainder of the position to $18'900. A break below $17'599 will indicate a more bearish view is playing out and we will consider that if it occurs.
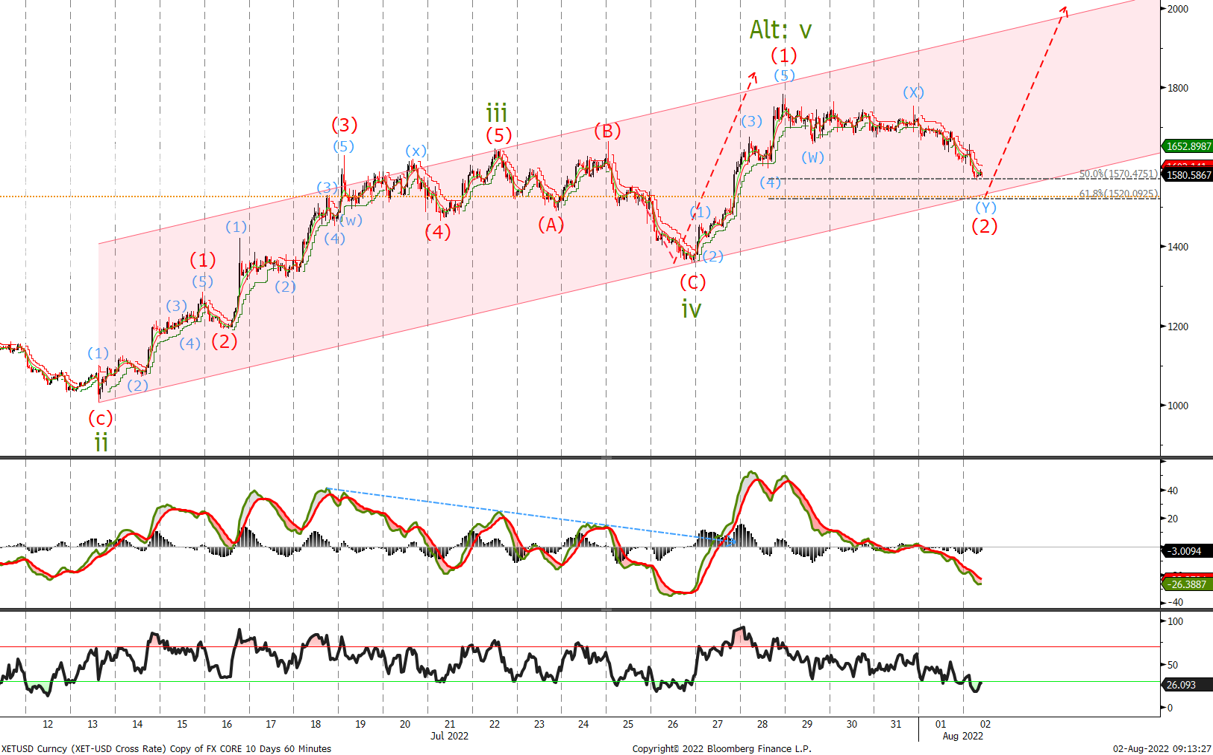
Ether
Last week we said:
'given the divergence in the MACD, I am looking for a sell off into the $1'325 / $1'400 area where we would again look to buy’
We traded down to $1'356 enabling us to go long. Raise that level now for stops on recent long or reduce longs at $1'270. A break there would signal that a larger correction for ETH will unfold over the coming weeks, till then remain long.
A break of the $1'000 level will negate the current bullish view. A move back above $1'690 should signal the next leg higher is underway.