
Bitcoin Weekly Chart
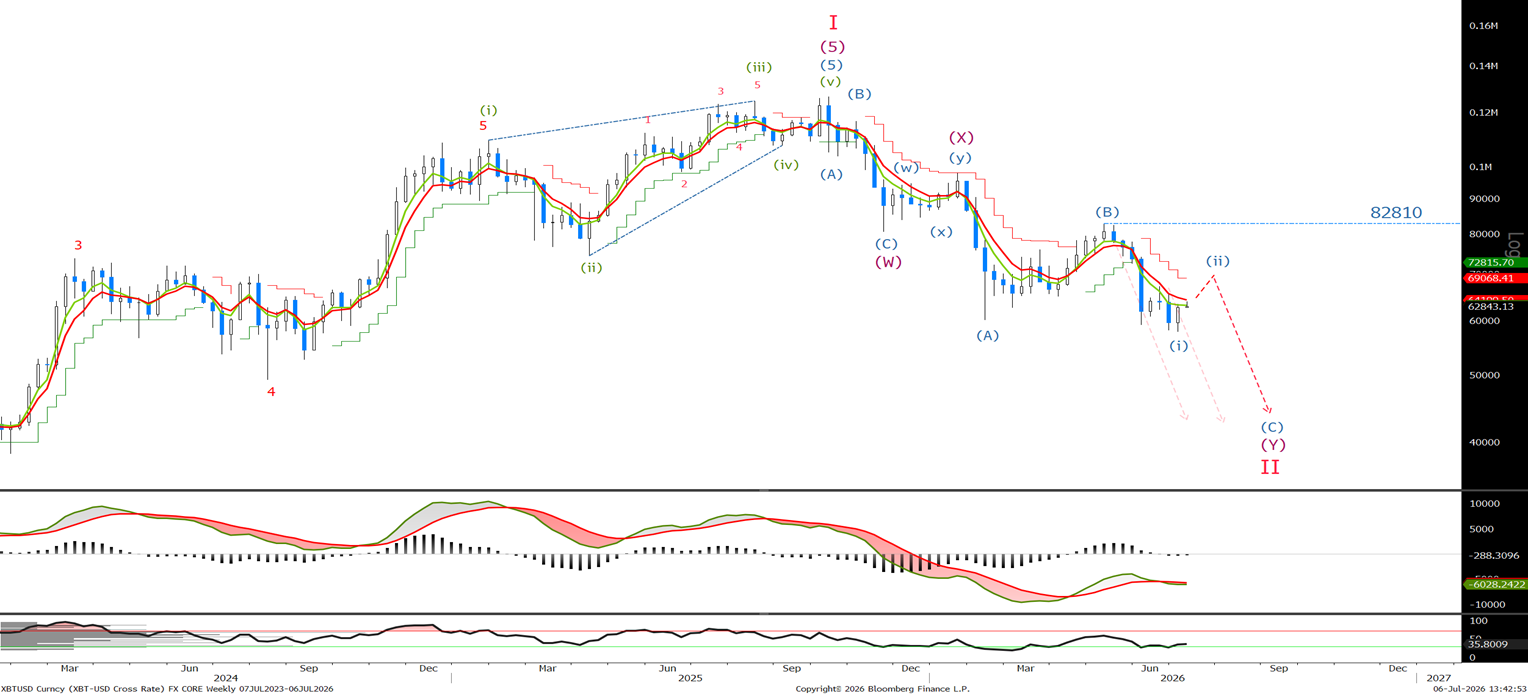
For several weeks I have been saying 'We remain bearish whilst below 82810 on a weekly basis-' Over the next couple of weeks, I believe we could see a rally in a corrective wave (ii) before the long-term bearish trend reasserts itself. When you look at the short-term charts, I will explain why, at least for a few days, I am looking for the BTC to trade higher. Nothing in the long term has changed I do not expect 82810 to be tested.
Bitcoin Daily Chart
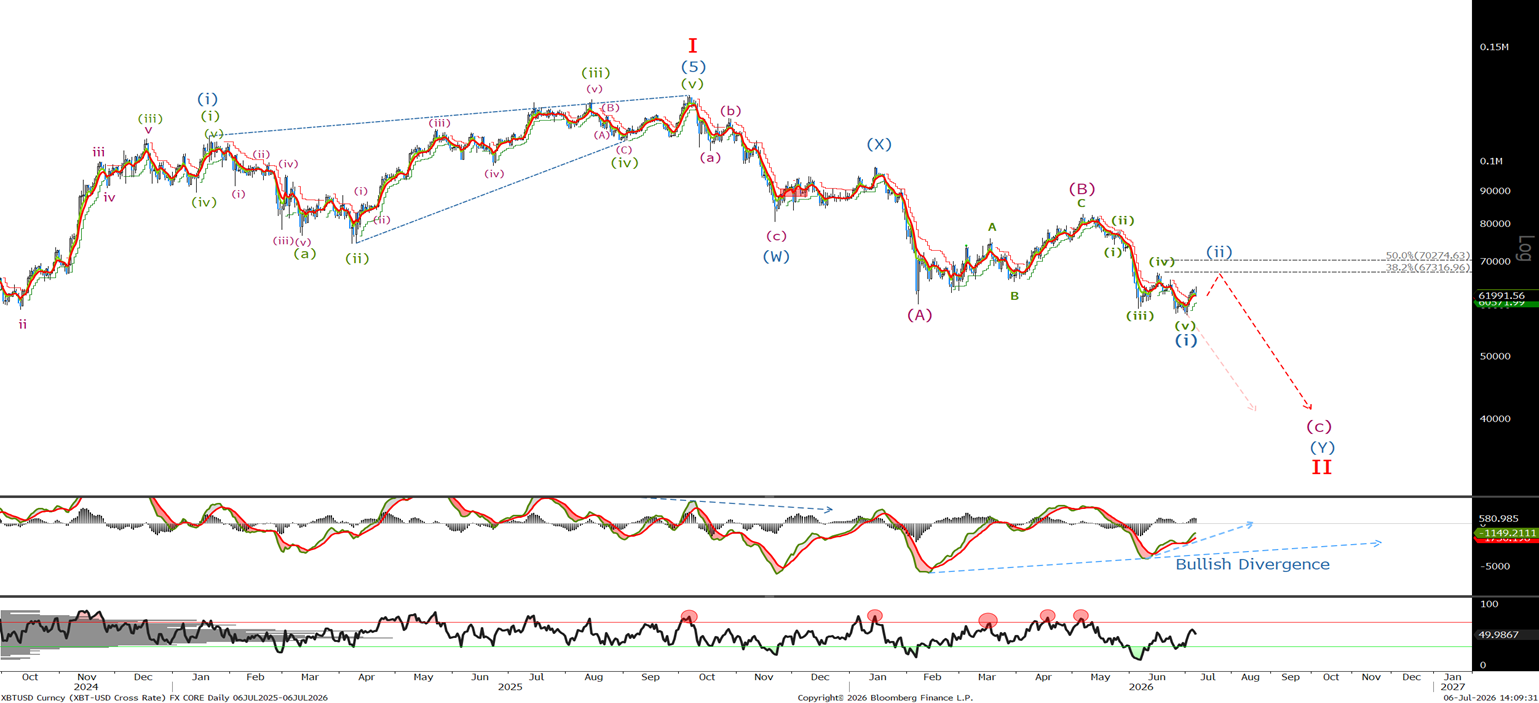
If, as I will show, we have completed 5 waves lower, then we should be followed by a 3 wave correction into the 67.3k to 70.3k area. I would look to sell up there. A break below last week's low at 57742 would signal the correction is over. However, we need to look at the short-term charts to see where we are in this correction leg.
Bitcoin Short Term Chart
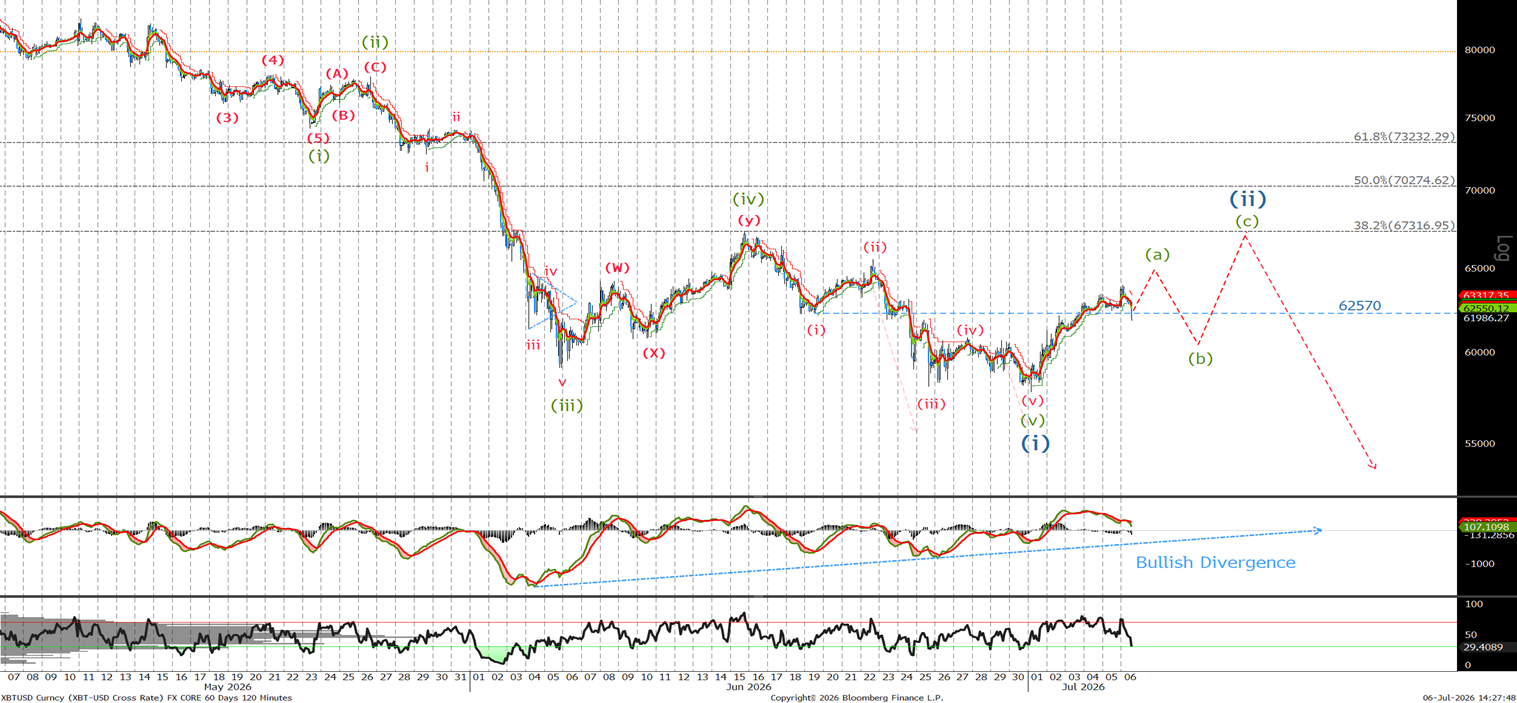
Last time I said, 'we must remain below the wave (i) low before making a new low to complete 5 waves of this leg lower. Once a new low has been made, or we trade above 62570, I think we will see a larger retracement up towards the 38.2% level at 67020 and the area of the previous larger wave (iv). I am showing here the wave count of the lows , Given the bullish divergence in both the daily on the previous page and here in the 2 hour.
Ethereum Long Term Chart
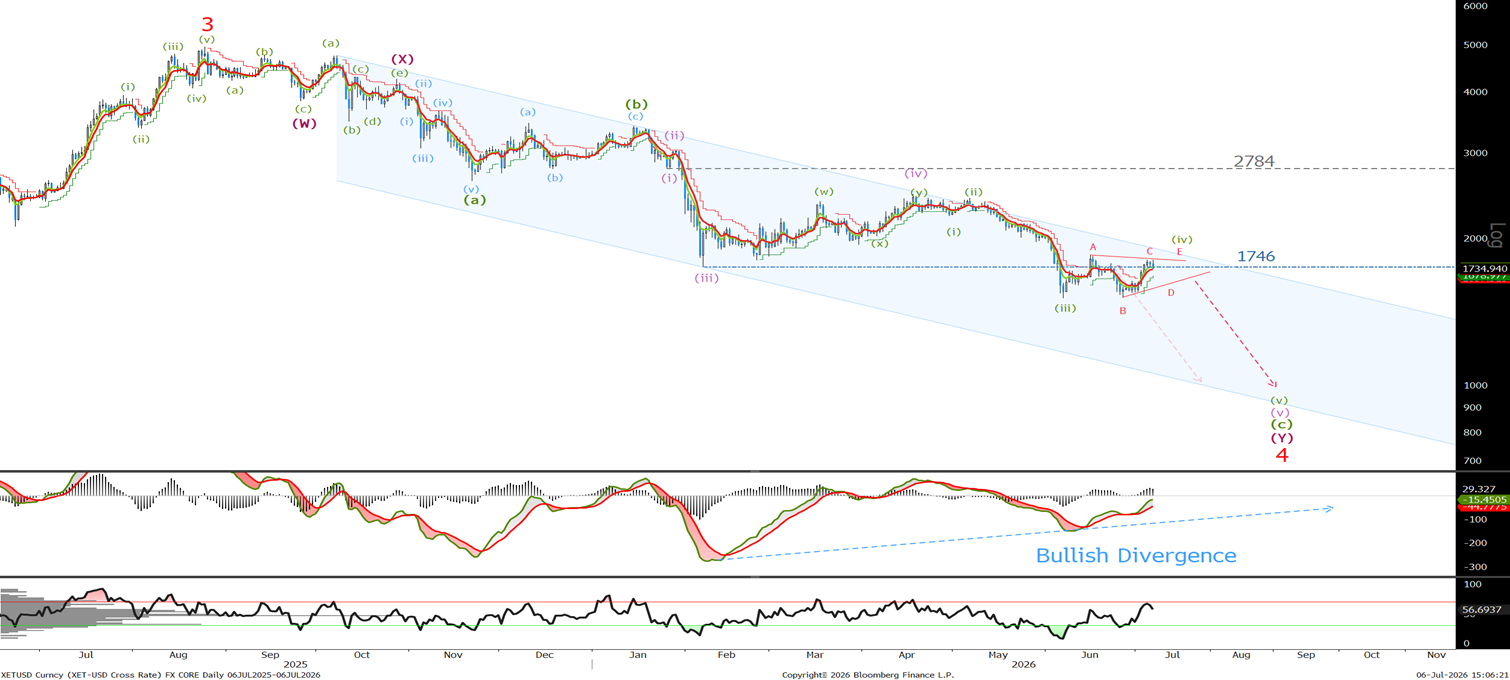
2 weeks ago I said ‘As you can see, I have labeled the correction as a wave (iv) and, on a daily basis, whilst below 2220 I will continue to look for lower.’ looking for a break below 1505 to complete 5 waves lower. But we need to see where we are in the short term.' It appears the wave (iv) is taking the form of a corrective triangle before the wave (v) lower gets underway. Longer term, we remain bearish.
Ethereum Short Term Chart
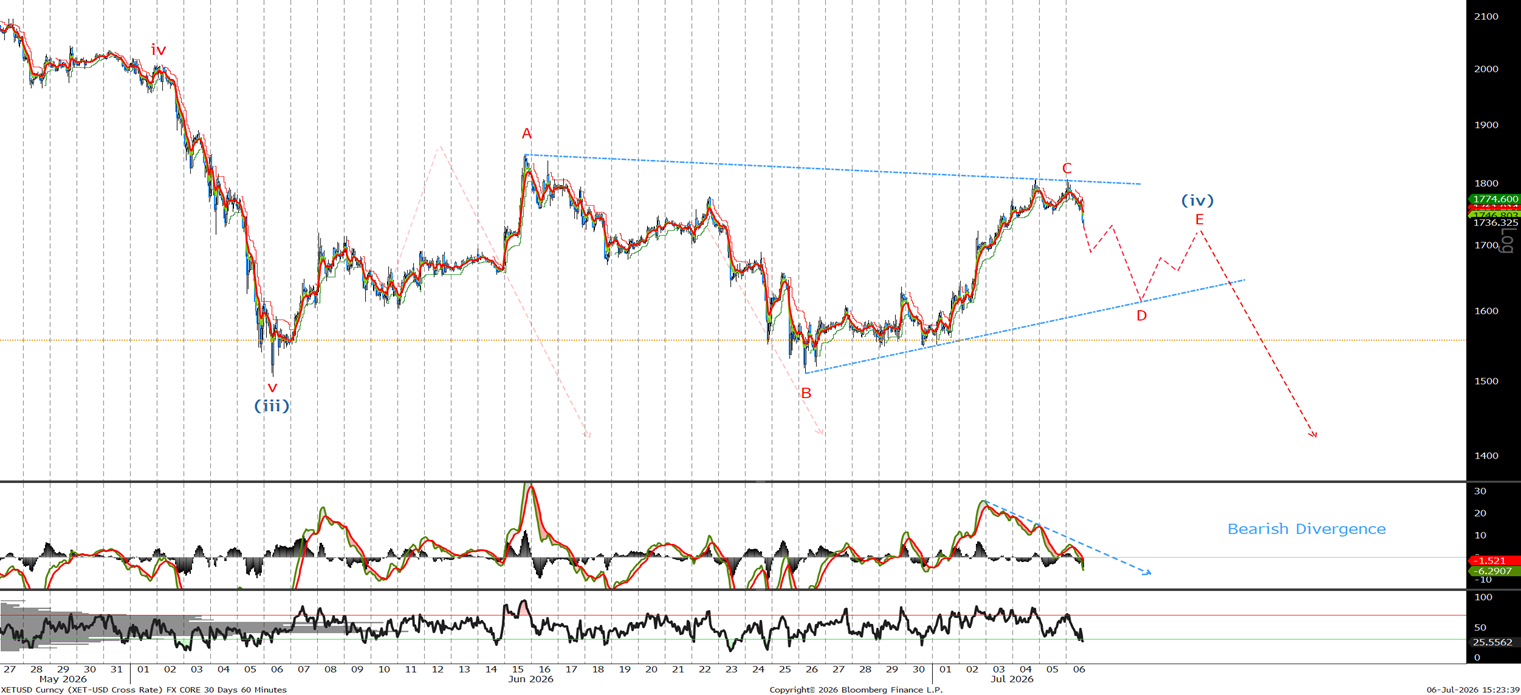
Last time we said ‘I believe we are currently correcting in a wave (iv) triangle that implies another push to new lows whilst we trade below the wave i low at 1670.' We made an equal low before trading back up to 1806 this morning. Given the failure to break lower, yet we have bearish divergence, I think we are in a wave (iv) triangle. I am happy to sell now at 1730 with stops above the wave A high in the short term at 1850.