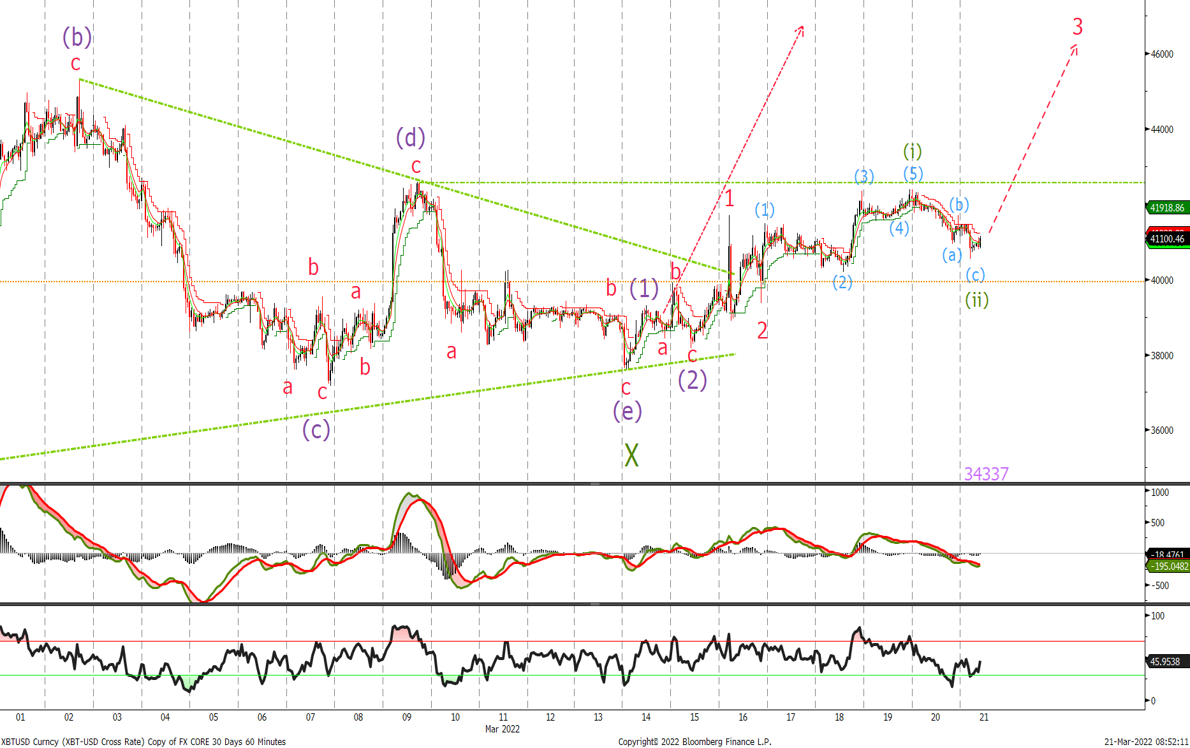
BTC
Price has broken out above a closing triangle with a move above $41'700 in play with a target of $52k whilst price remains above $37'500
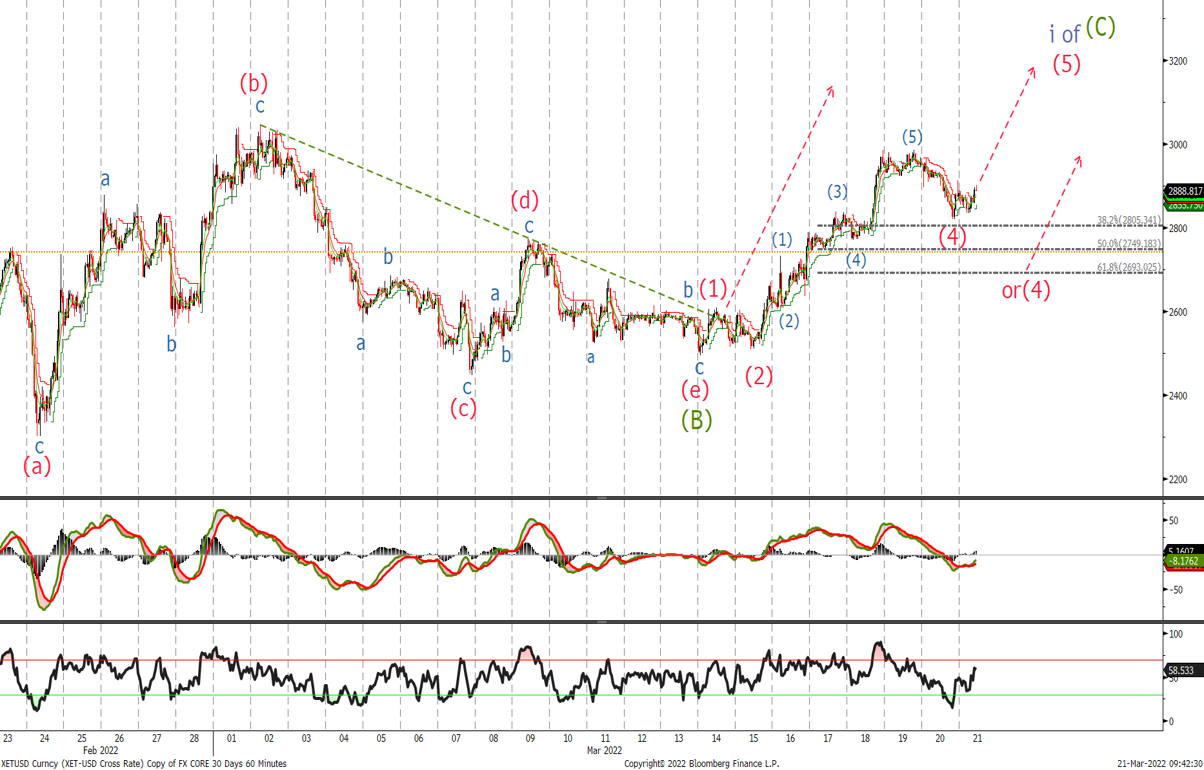
ETH
A rally above $3'050 is in a play however another sell-off to $2'695 / $2'750 is possible if the wave 4 correction isn't complete yet
Bitcoin Short-Term Chart
Last time we said:
‘It appears that we have completed (or are close to completing) a corrective triangle that calls for a move higher. A break out of the triangle followed by a close above wave (d) which is last week's high and will confirm the next leg up is underway’
We haven’t closed above the wave (d) high at $42'566 but will remain bullish on BTC following the breakout of the triangle.
Whilst above $37'500, we will look for a move above $41'700 which will be the first indication that the wave 3 higher is underway followed by a close above wave (d).
Target to the topside is around the $52k level.
Ether Bullish Chart
We said last week:
‘We should stay above last week's low at $2'446 now, place stops there or leave a stop at $2'300. Looking for an acceleration to the topside to get underway’
We traded slightly lower to $2'509 since the last update but far away from our stops before rallying to $2'985. We have either completed the wave (4) correction or we might see another sell-off towards the $2'695 / $2'750 level.
In either case, a rally to a new high above $3'050 to complete 5 waves up from the first leg higher is in play. Look to buy on this dip and raise stops to $2'450 or $2'490.