
Bitcoin Weekly Chart
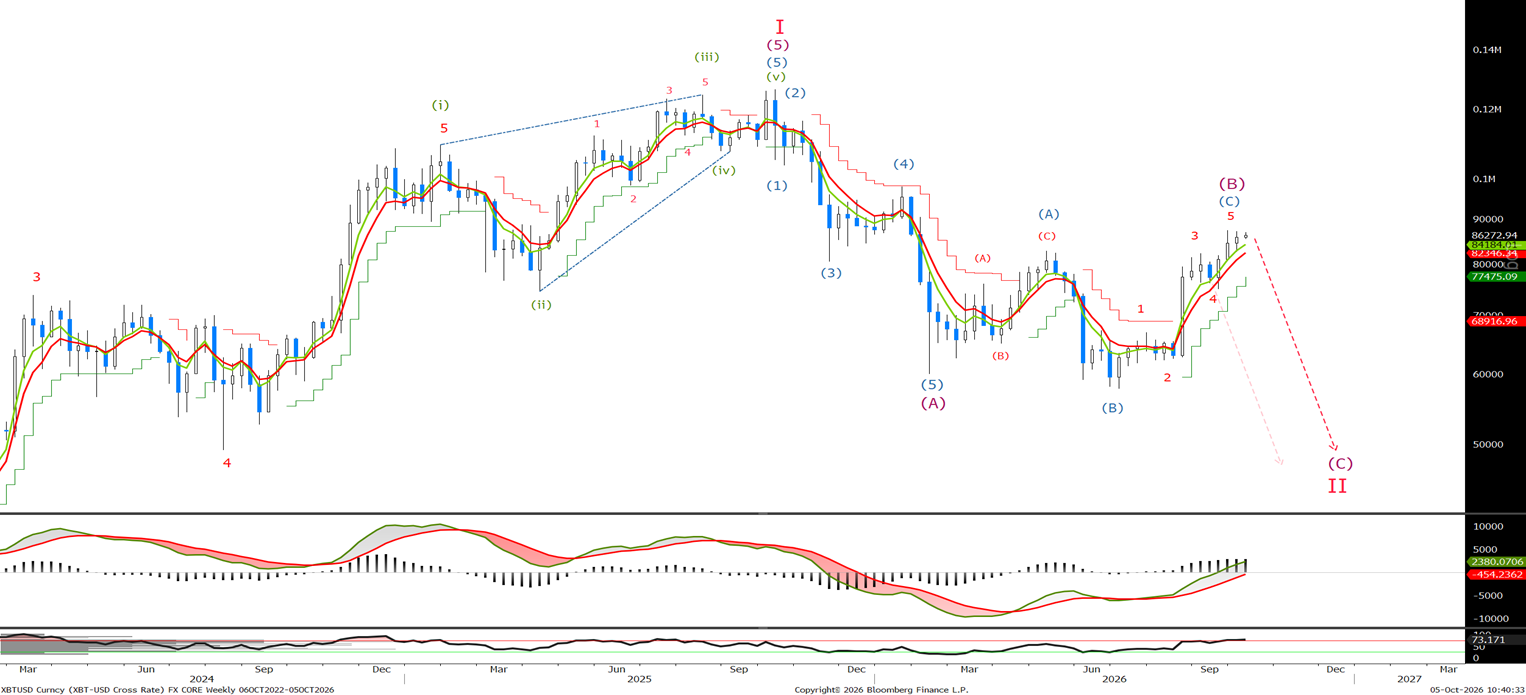
Having broken 82850, our bearish count became invalid in the short term. I have taken a step back and started again in the long-term chart , before breaking it down into the shorter term and looking at the new count, it appears we are close to or have finished 5 waves higher to complete the wave (B) correction. This count is in fact that not much different than before, but does take into account the recent push higher.
Bitcoin Daily Chart
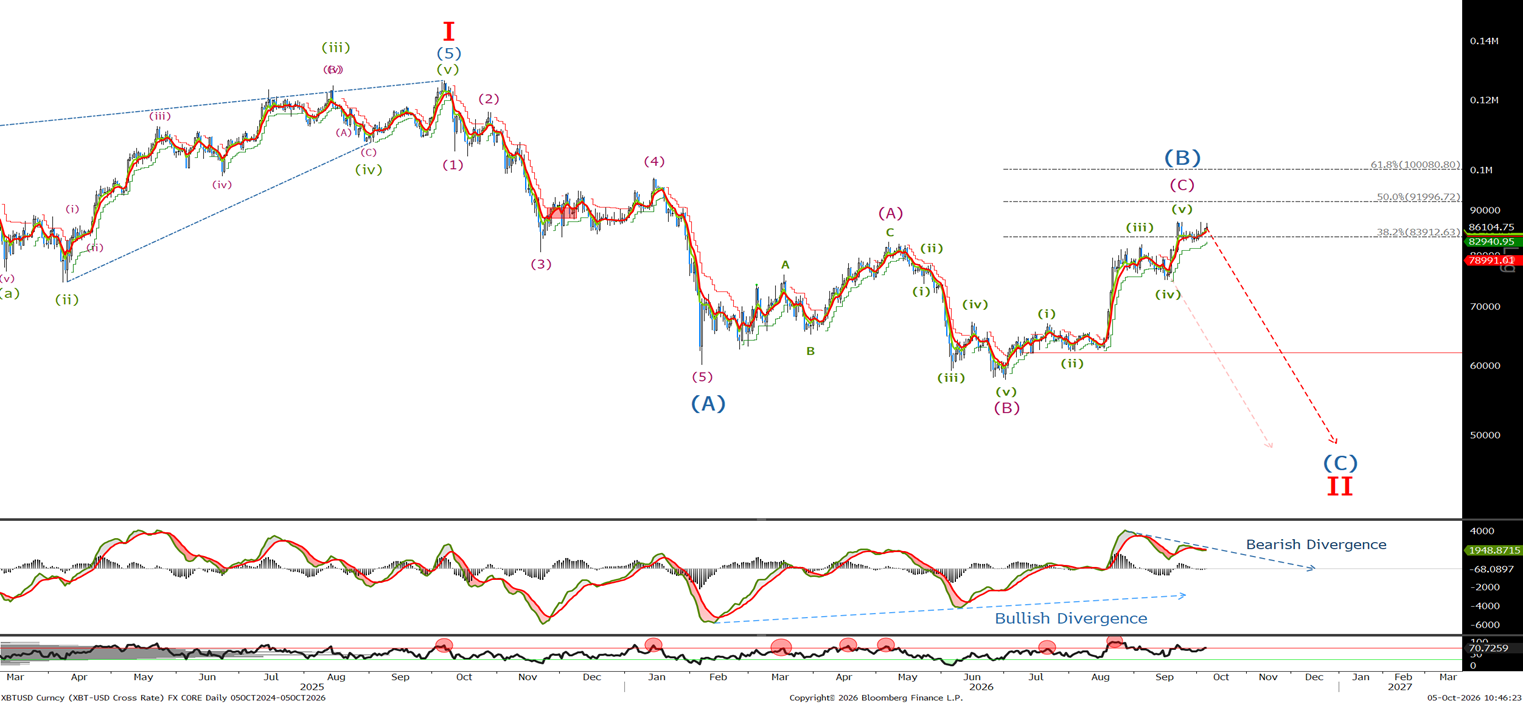
Once again, we have been stopped, but looking at the new count , given the bearish divergence in MACD I am looking for the sell-off to resume soon. Wave (B) has either completed, or the recent sideways action is actually tracing out a triangle correction before one more new high towards the 92k and possibly a test off the 100k level before the sell of resumes . But whilst below 87382, I will look for lower. Close, shorts and go long above and resell at the levels mentioned.
Bitcoin Short Term Chart
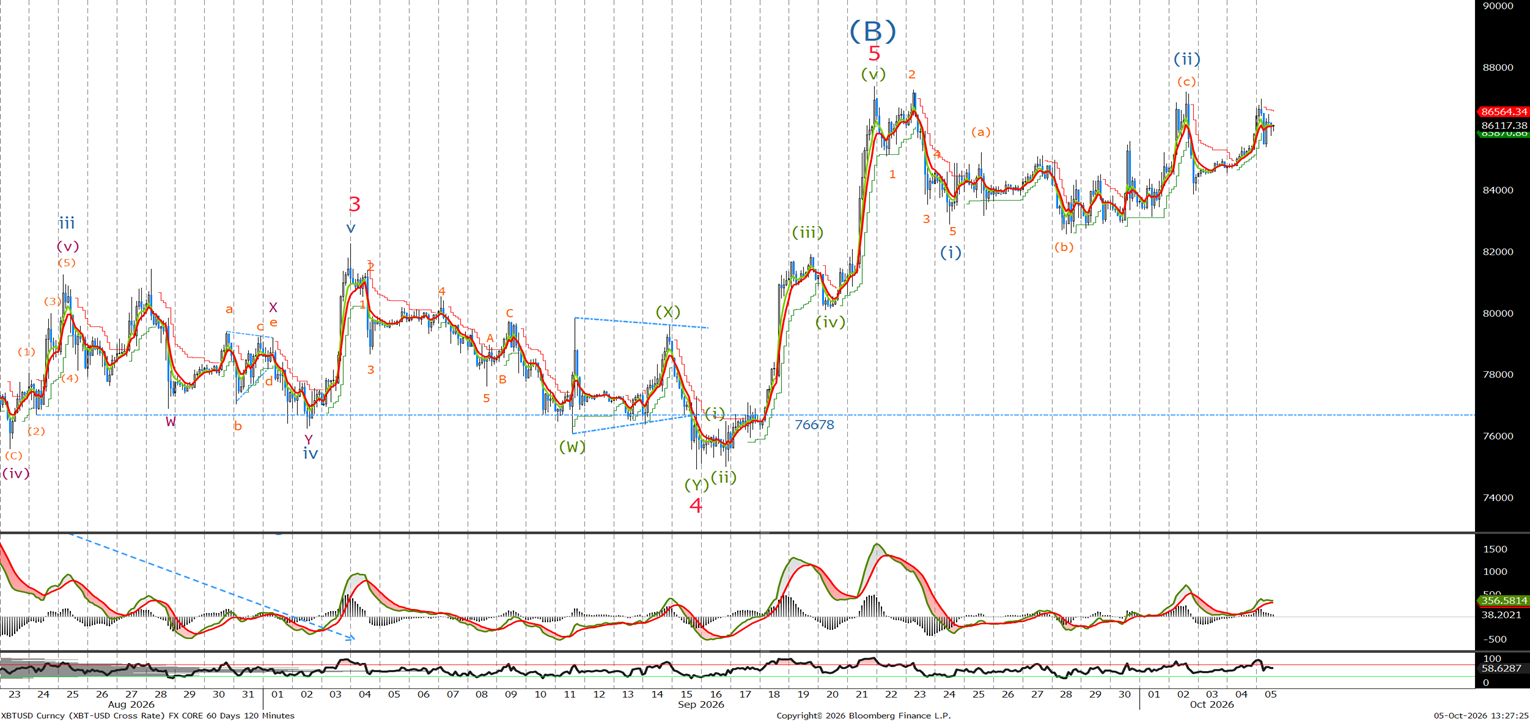
You can see the importance of the wave (B) high. I expect to see an acceleration to the downside on a 2-hour close below 82568. If the alternate view comes into play, I will resend the chart later in the week. Until then, I am selling now on a risk-reward basis. This could be the trade of the year.
Ethereum Long Term Chart
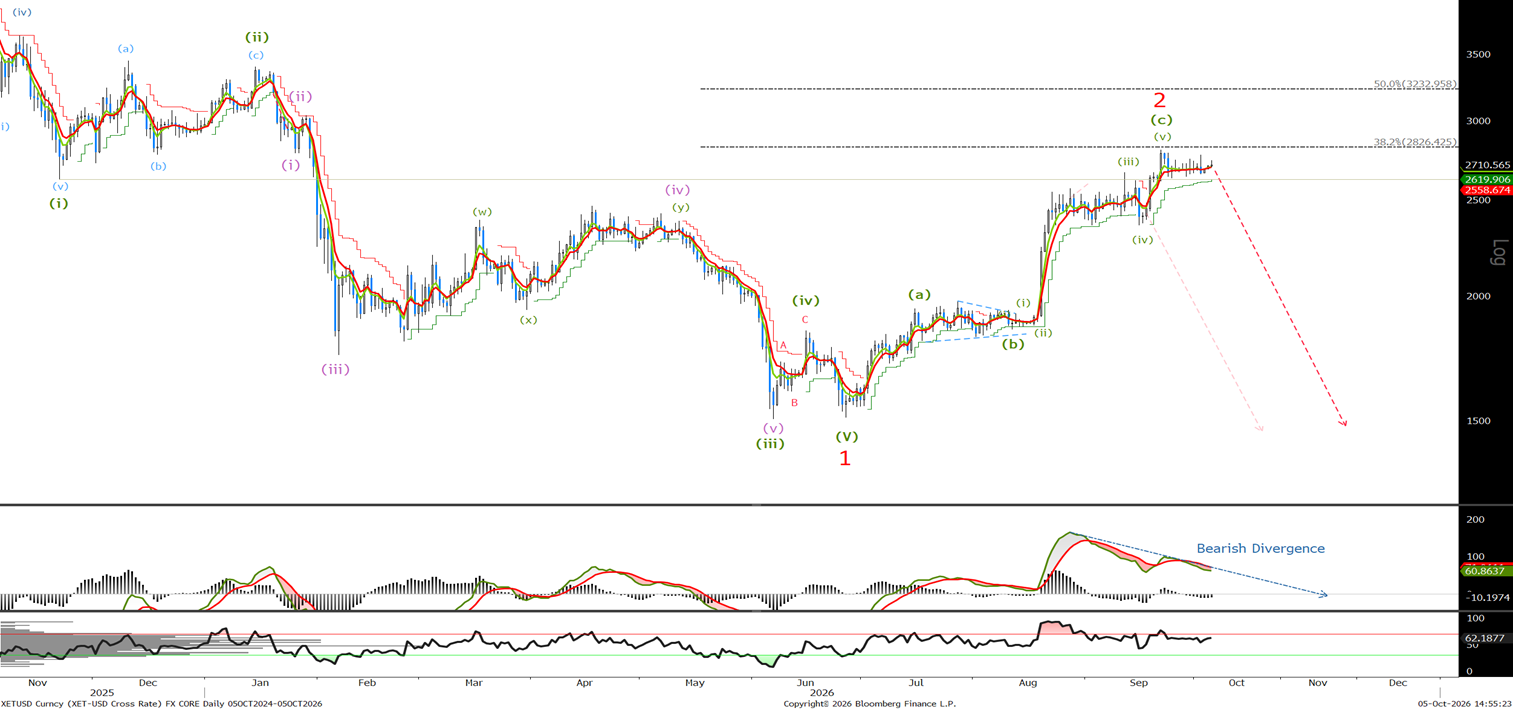
Last time, on a daily basis, we were calling on top in place but were apprehensive due to the lack of acceleration to the downside. We traded higher, closing out our short positions before testing the 38.2% retrace level at 2807. Given the bearish divergence in the MACD I expect to see an acceleration lower on a daily close below 2600.
Ethereum Short Term Chart
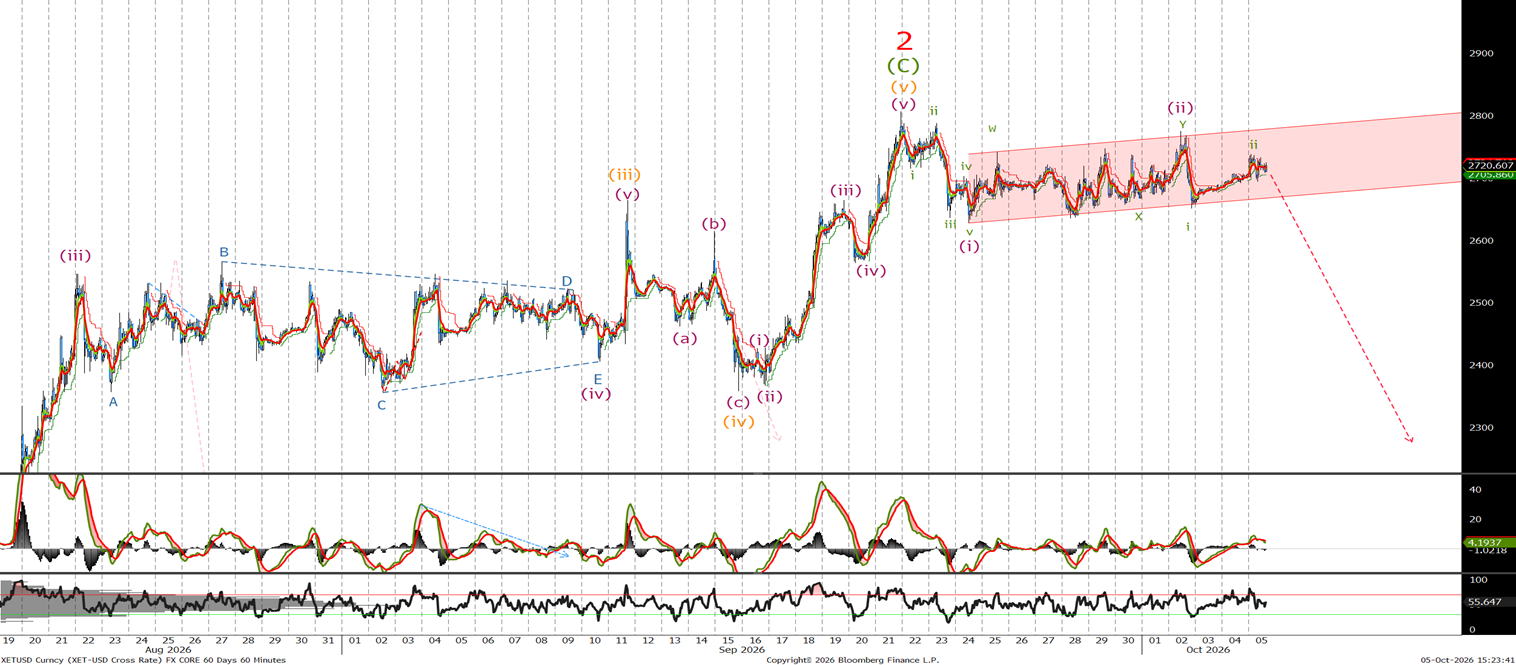
As you saw from the daily we got stopped on our short positions , but on the hourly last time I said 'There is a possibility that we are tracing out a corrective triangle for an ongoing wave (iv) in the long-term chart, that call for one more push higher before the wave 2 is over, but I will show that if it comes into play and prefer to remain bearish at this time.' So here we are turns out the triangle was true and we have pushed up to a new high like BTC I am selling now at 2720 with stops above the wave 2 high at 2810.