Bitcoin Long Term Chart
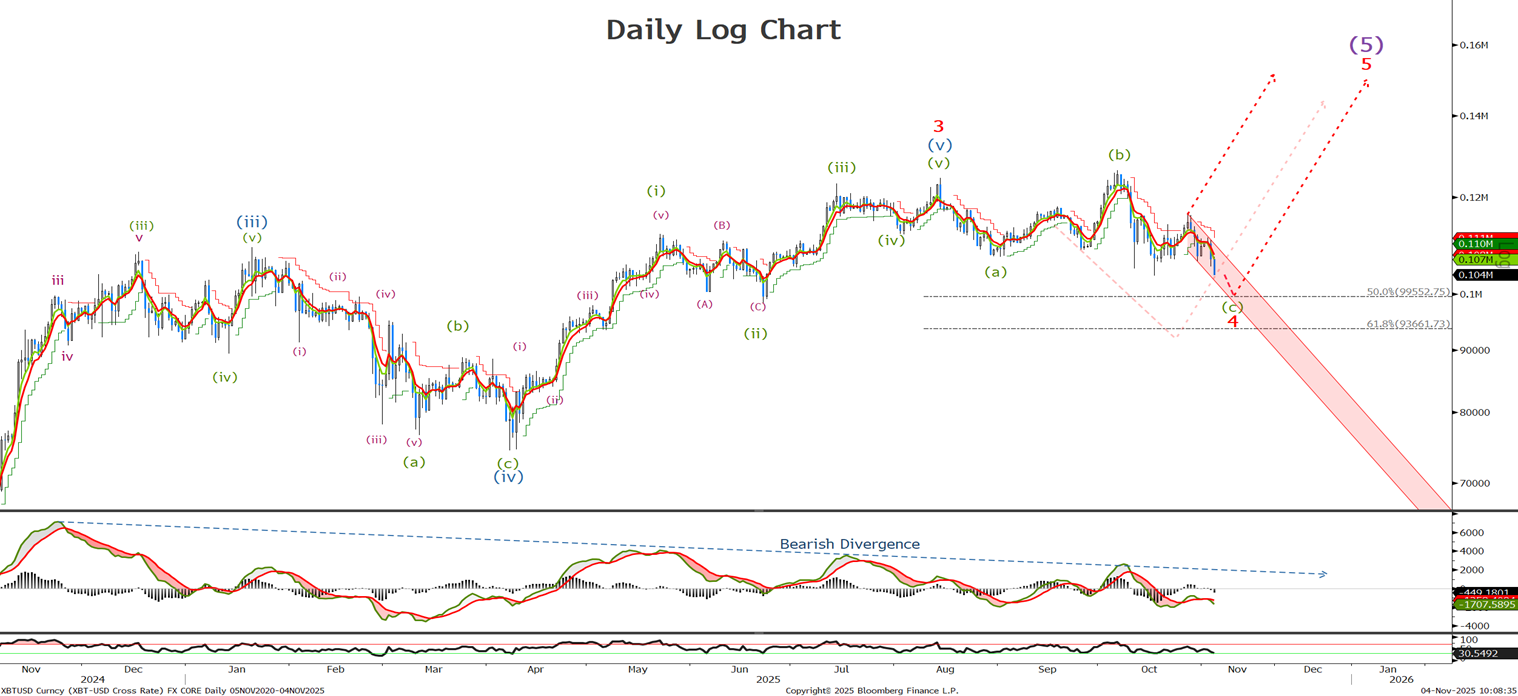
Last time we said ‘whilst above 103.6K we will remain bullish in the long term.’ I was expecting the BTC to power on and as I type this we are testing the 103.6k level. If we break then I expect to see a push down to test the 99.5-100K level or possibly lower to the 93.6K retracement levels , but we need to look to see the short term price action for an idea where we are in the current wave (c). Long term nothing has changed and we will use this correction to add to tongs before wave 5 to new highs gets underway.
Bitcoin Short Term Chart
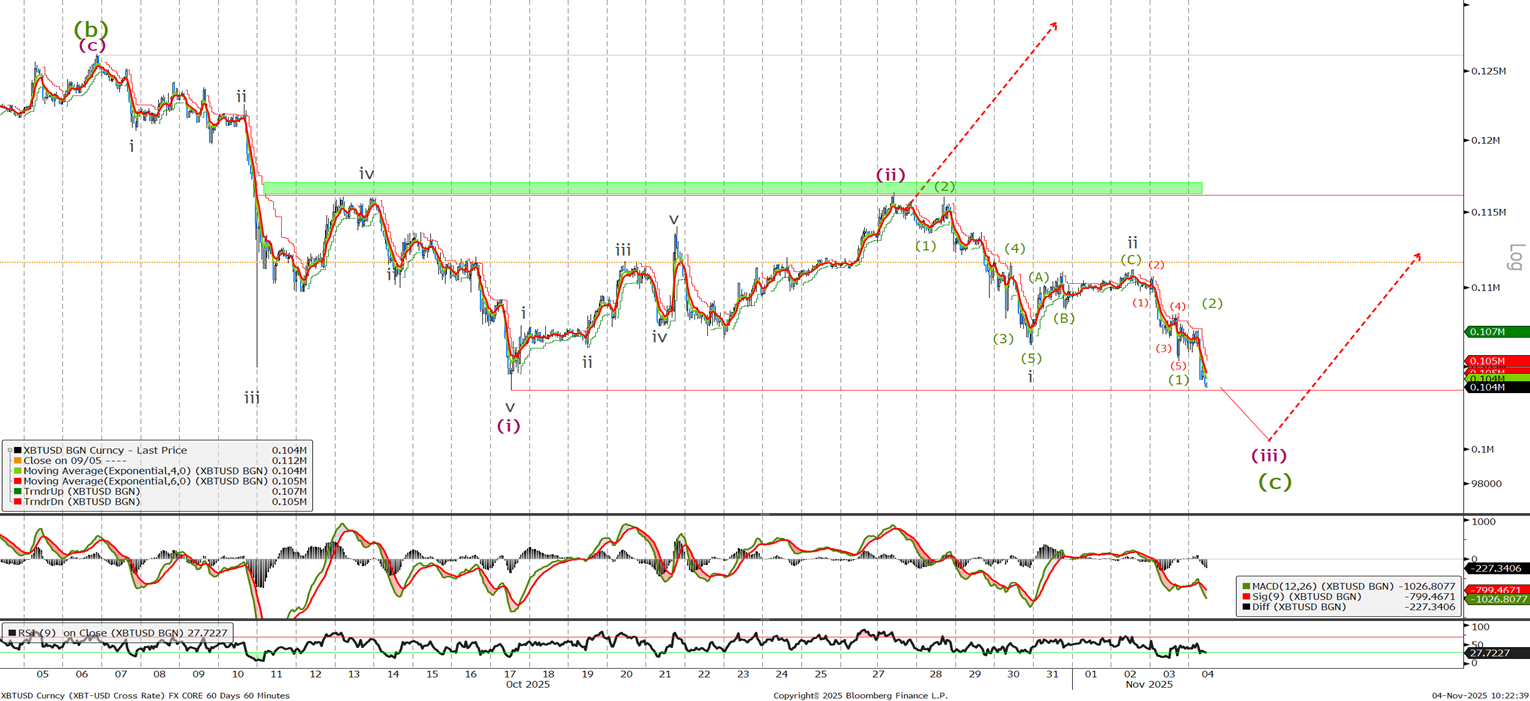
Last time we said ’ We have since rallied in three waves, so there is the possibility that only wave (A) of a larger flat wave 4 has been completed.’ Unfortunately I favoured the other view but it is good to know the alternative was correct and we should now sell off in 5 waves. It looks to me that wave (iii) of (v) is underway so a break below last weeks low I believe will see a push past the 99.5 level and I will look to add at the lower 96K level and look to see the price action for signs of a completion.
Ethereum long Term Chart
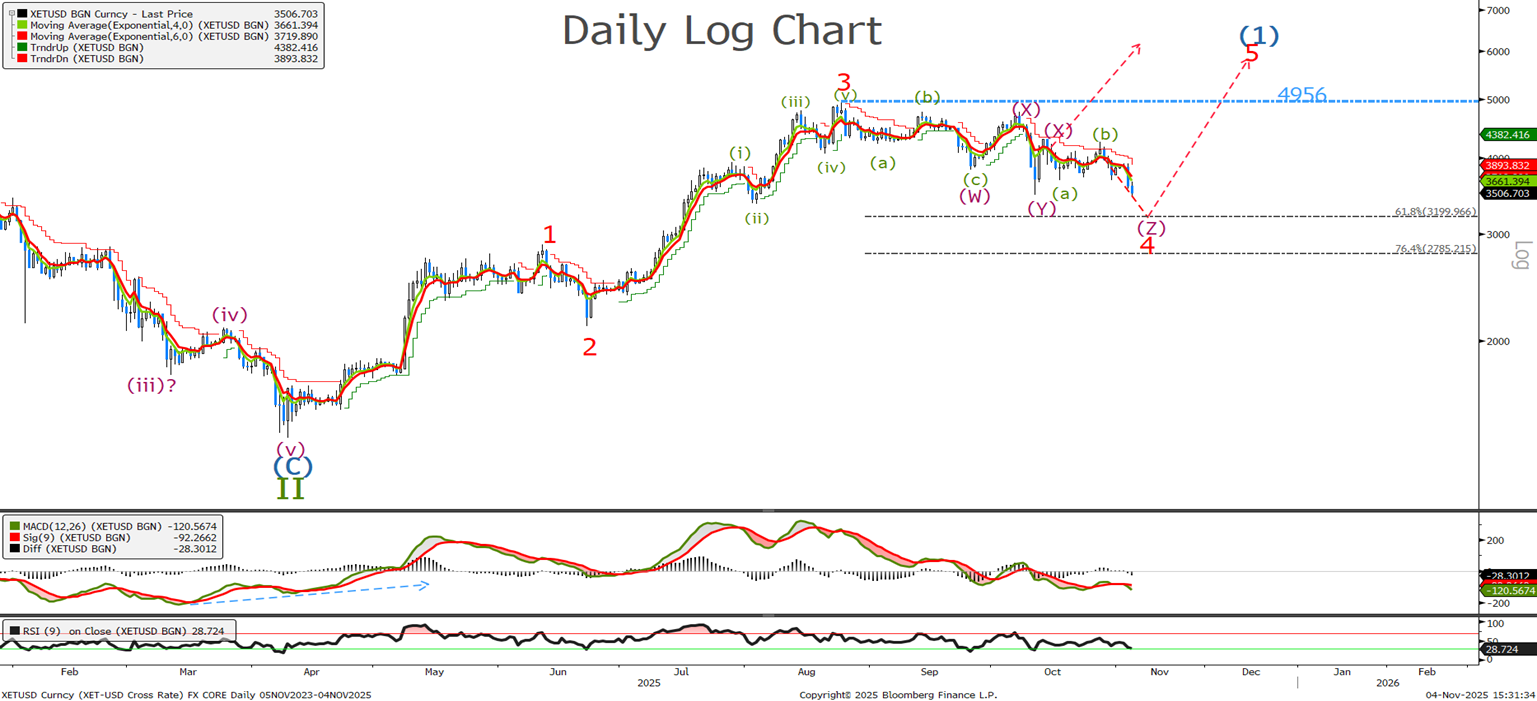
Last time we said ‘We have pretty much traded sideways since the last update but given that wave 4s are often more complex I think it may break lower towards the 3200 level.’ Given we have sold off inline with the last update lets try and break the wave (Z) down to see possible buy areas.
Ethereum Short Term Chart
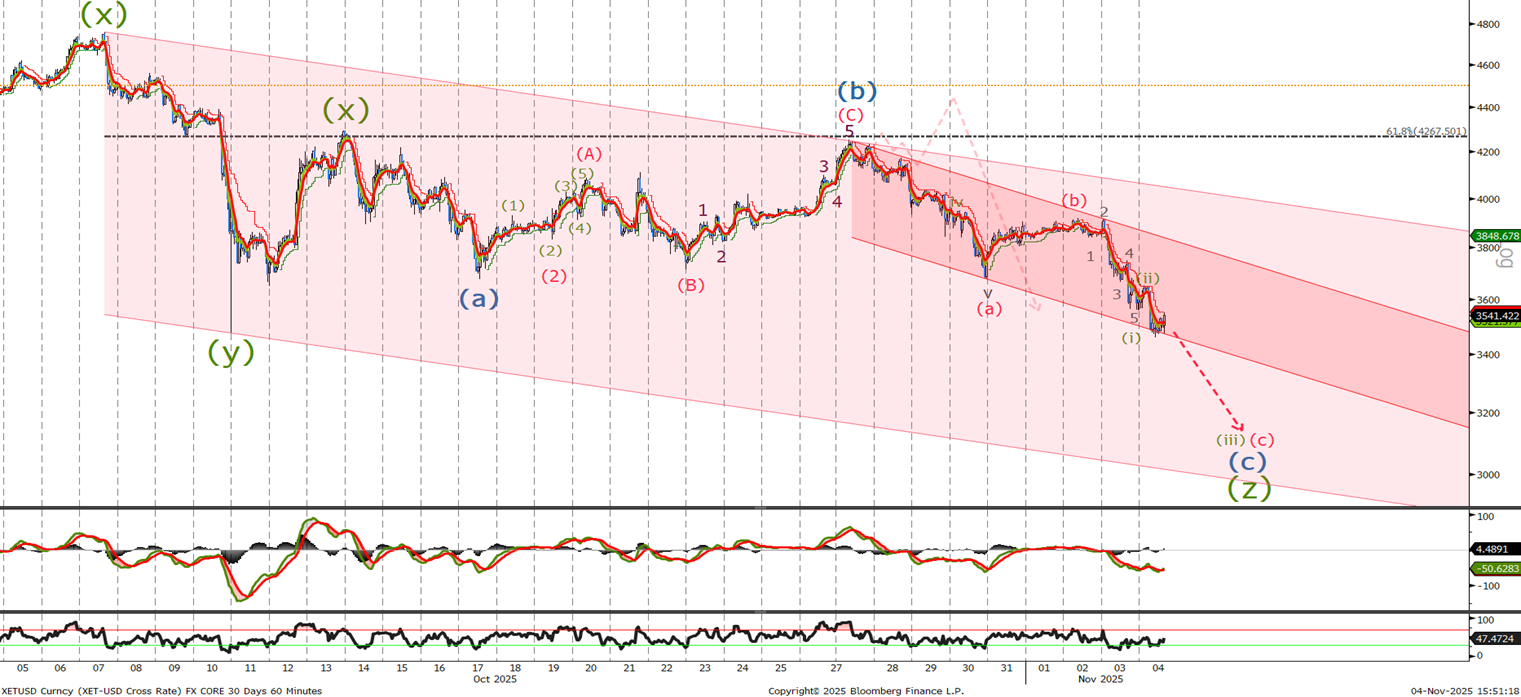
Last time we were looking for one more push higher before selling off so we double topped around the 4267 level to complete wave (b) missing our sell target. From the chart it would appear we have several more minor legs down to complete wave (z) and end of the wave 4 correction. Also with no signs of momentum running out on both the long and short term charts I expect to see a push lower to the 3200 level and depending on the weakness a test of the 3000 level.