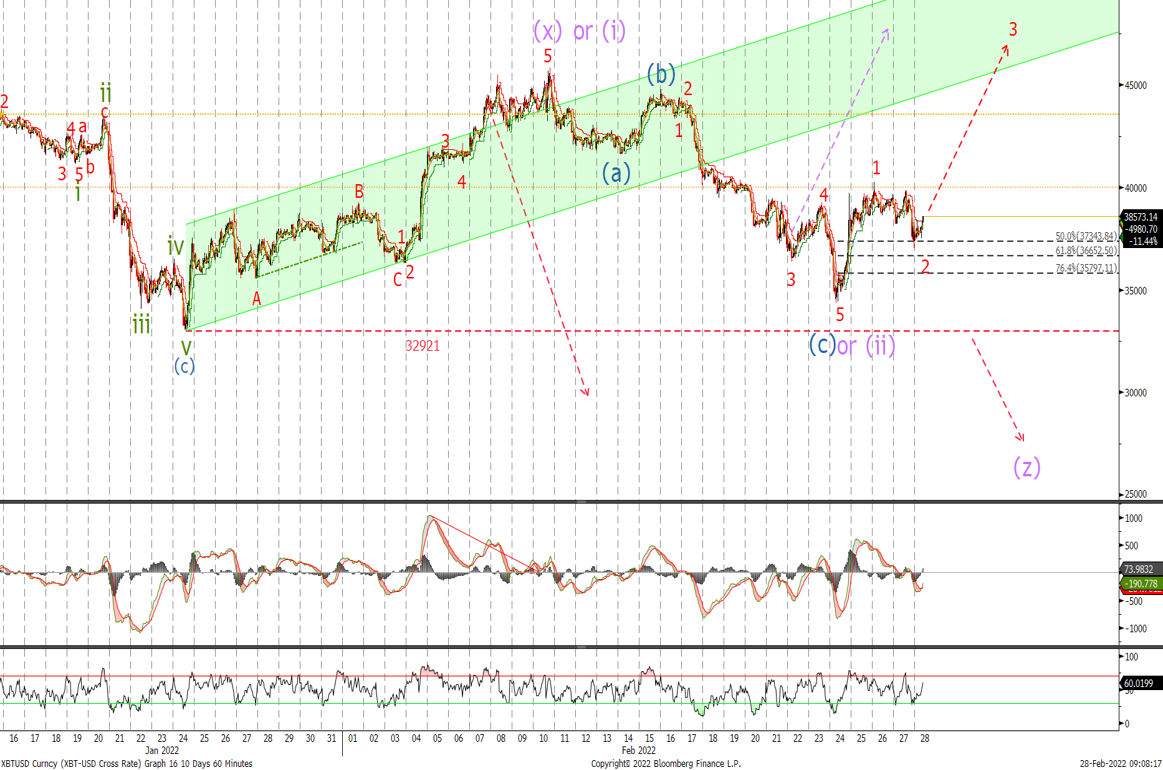
- BTC is expected to move up to $41'700 with a move above $39'800 confirming this move higher
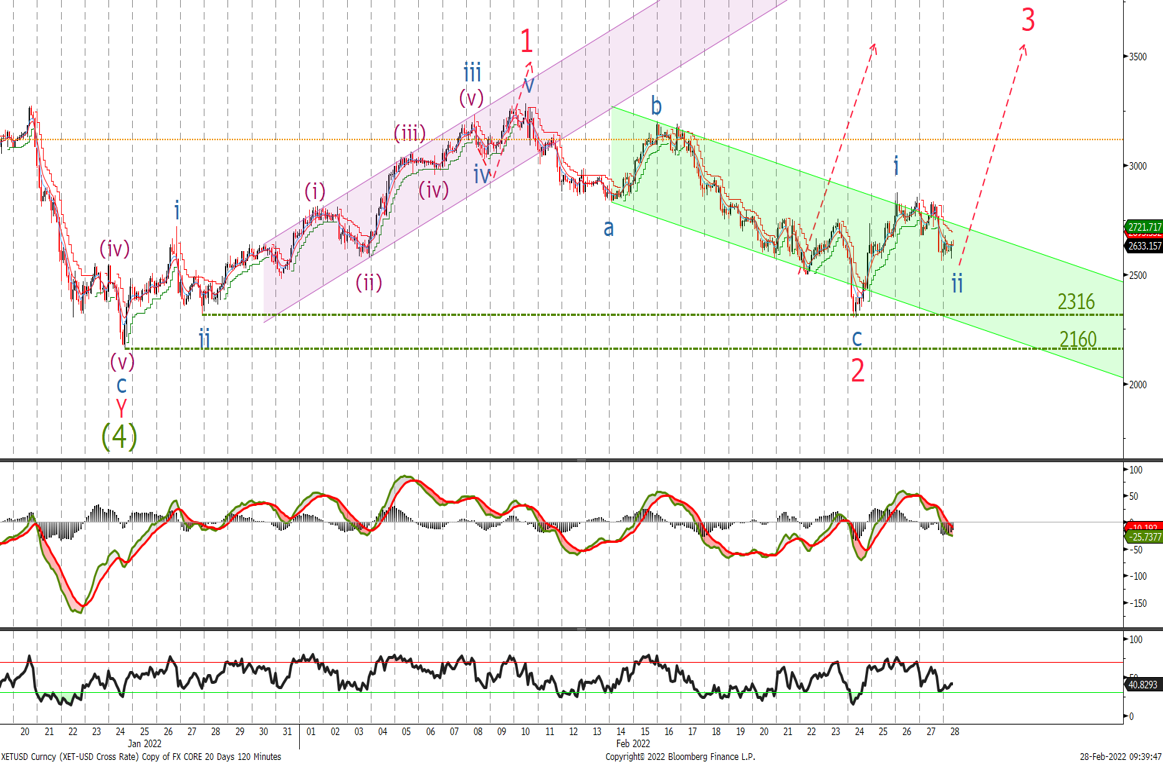
- ETH is expected to accelerate up through $2'850 if $2'160 isn't reached
Bitcoin
Last time we said:
‘We were looking for a sell-off and the market obliged. The question now is whether we have seen the low. At this stage it is not possible to decide on a certain direction. If a low is truly in place (shown by the or in the chart) then a move back up through $41'800 followed by $45'840 should happen in the coming weeks. Given the divergence in the MACD, a low for this sell-off at least should soon be in place and we would expect a move back above $41'000. I will update this view if the markets starts to turn. The larger zigzag correction is shown by the (z)'
There isn't really much change in the above view with a move below $32'921 confirming a larger zigzag correction is playing out. Until then we look for BTC to trade higher and would look for a move higher with confirmation on a move above last week's high. Followed by $41'700.
Ether
We said last week:
‘A break below $2'722 will be the first indication that the bearish view is the more dominant idea with confirmation that ETH is going lower on a break below $2'316. As we haven't broken that level, if bullish, then on a risk reward basis I would buy now at $2'590 and add at $2'425 with stops below $2'316'
As you can see, we tested $2'316 before sharply reversing. The bullish view is preferred whilst we trade above $2'160. Lower stops than this level with a break below would indicate that a more bearish view is underway. I remain long and am looking for an acceleration through $2'850 for what should be a sharp move higher in the coming weeks. Alternatively, I would buy a break of that level and place stops below $2'300.