
Bitcoin
- The short-term chart suggests a move back above $45k is in play in the coming weeks, as soon as the current low is set
- The long-term chart suggests that Bitcoin's macro uptrend is in play as long as $28k isn't reached
Ether
- The bearish short-term chart suggests that Ether can fall all the way down to $1.9k if price doesn't break above $3.2k
- The bullish short-term chart suggests that Ether's uptrend is in play as long as price doesn't break below $2.3k
Bitcoin
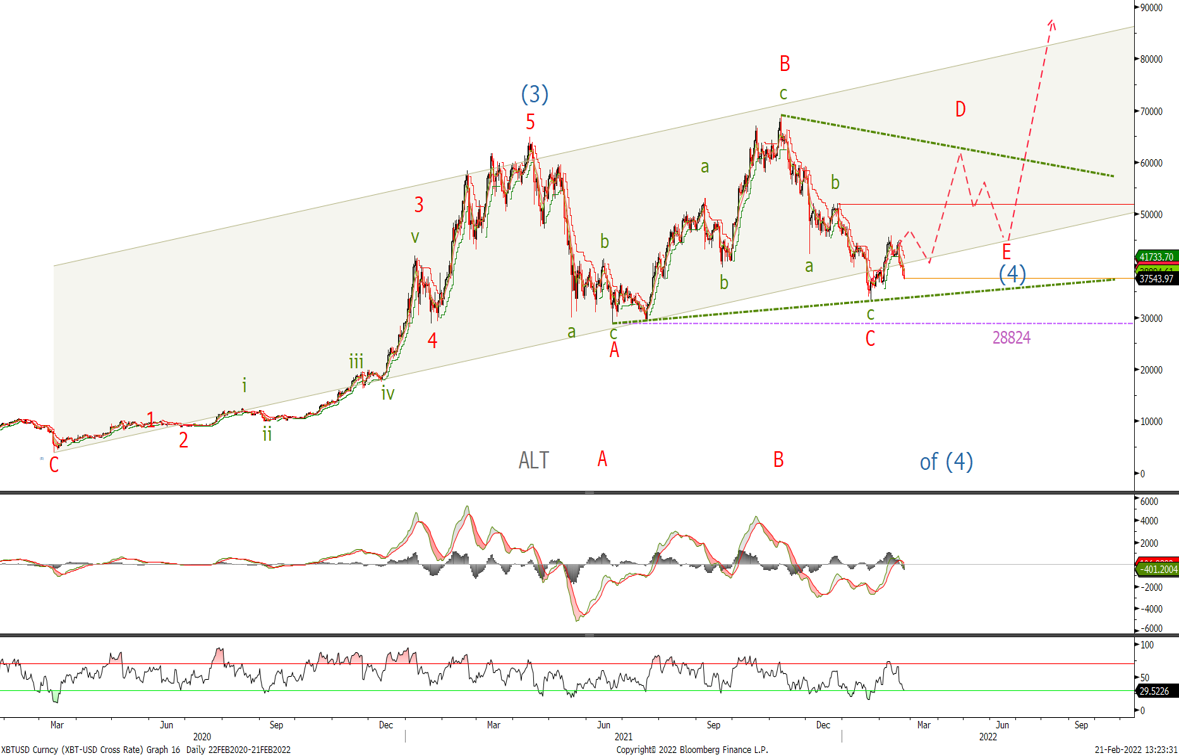
Bitcoin Long-term chart
I am showing the long-term chart from last time and have altered nothing on it. As you can see from the red line we were looking for it to go higher, followed by a correction before going higher in wave D.
We said last time:
‘wave D is underway should we not break $28'824’
If the correction is over, it would be a good entry point.
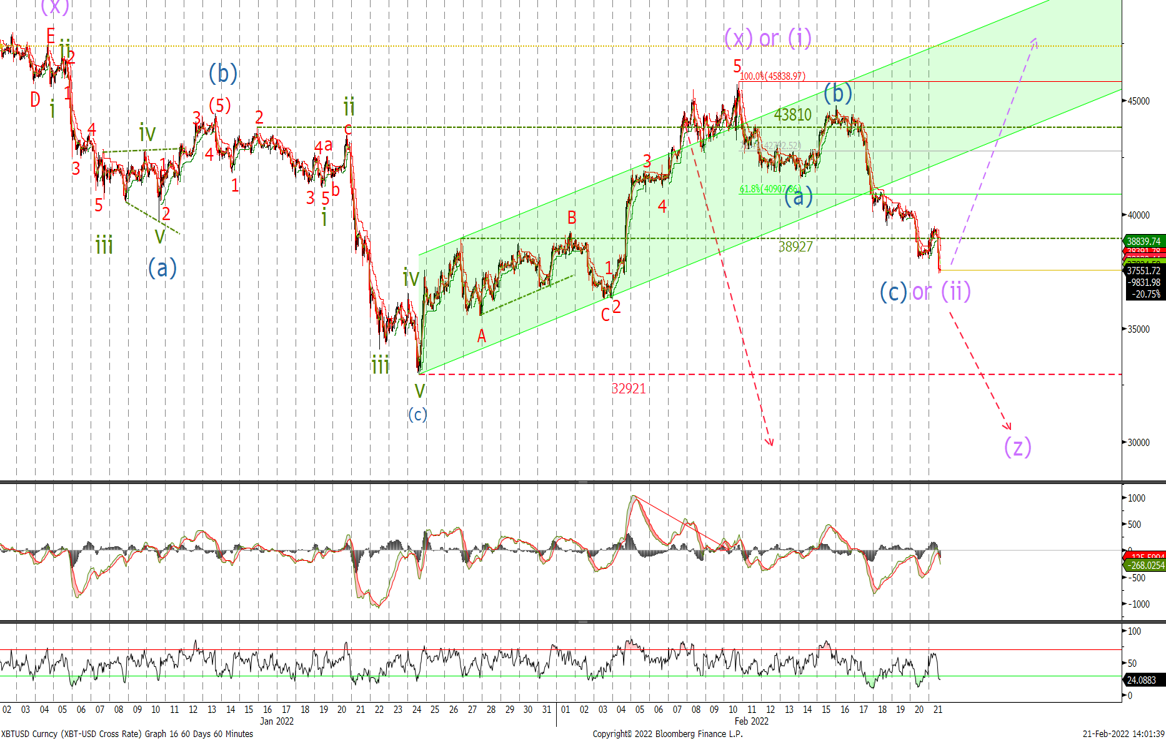
Bitcoin Short-term Chart
Last time we said:
‘we were worried that a larger zigzag playing out and ‘A move below $38'927 would add weight to the view of this chart and as mentioned last week and ’take the form of a zigzag to new lows below $29'000 to complete the larger wave (4)'. It will take a move above $69k to confirm Bitcoin's bullish trend has resumed. Close long at current levels or raise stops to $38'927 or $35'450’
We were looking for a sell-off and the market obliged. The question now is whether we have seen the lows, and at this stage it is not possible to be certain. If a low is in place (shown by the 'or' in the chart) then a move back up through $41'800 followed by $45'840 should happen in the coming weeks, given the divergence in the MACD.
Either way, a low for this sell-off should soon be in place, therefore we would expect to see a move back above $41'000. I will update this statement if the market starts to turn. The larger zigzag correction is shown by the (z)
Ether
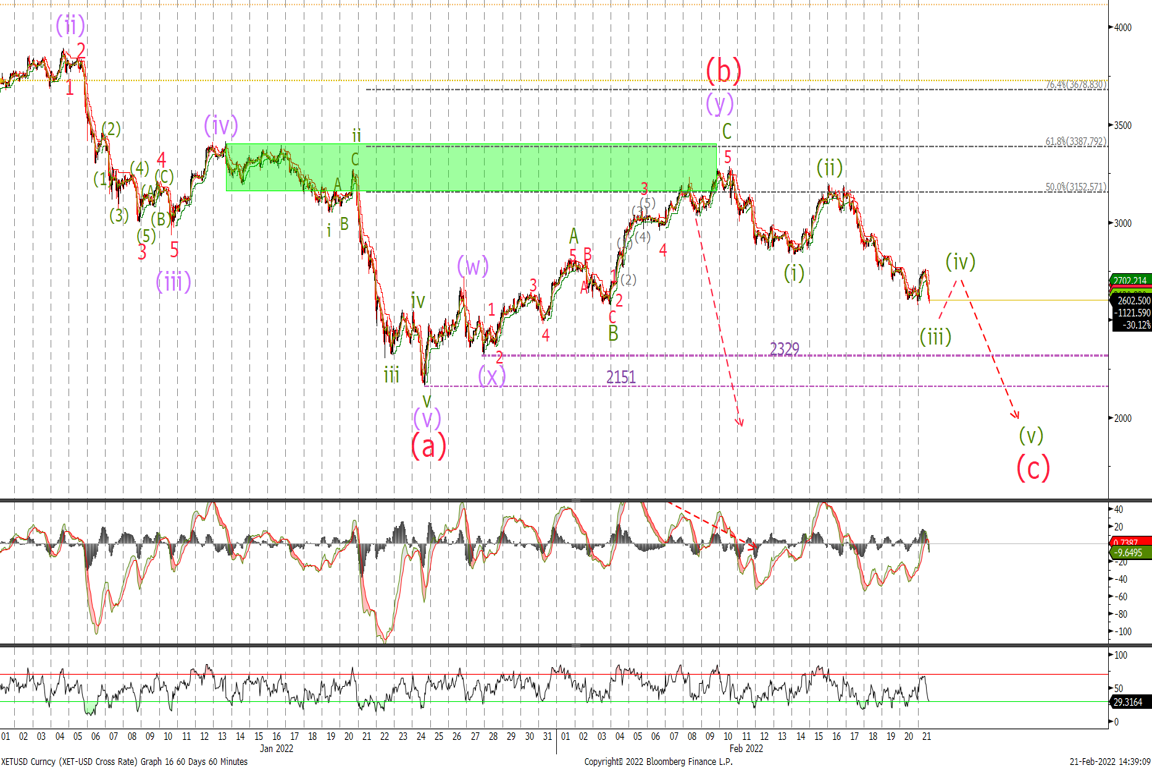
Ether Bearish Short-term Chart
Last time out we said:
‘Looking at the short-term chart, I am looking for ETH to sell-off from these highs. Depending on the price action, it will decide which direction price goes for the next few weeks.
A move below $3'050 will be the first indication that a top is in place, followed by $2'950. Confirmation that the more bearish view is in play will come if we close below $2'570 followed by the wave (x) low at $2'329.’
The sell-off is in line with expectations, as I am showing the more bearish view as shown last week with potential for a new low towards $1'900 whilst we trade below $3'200.
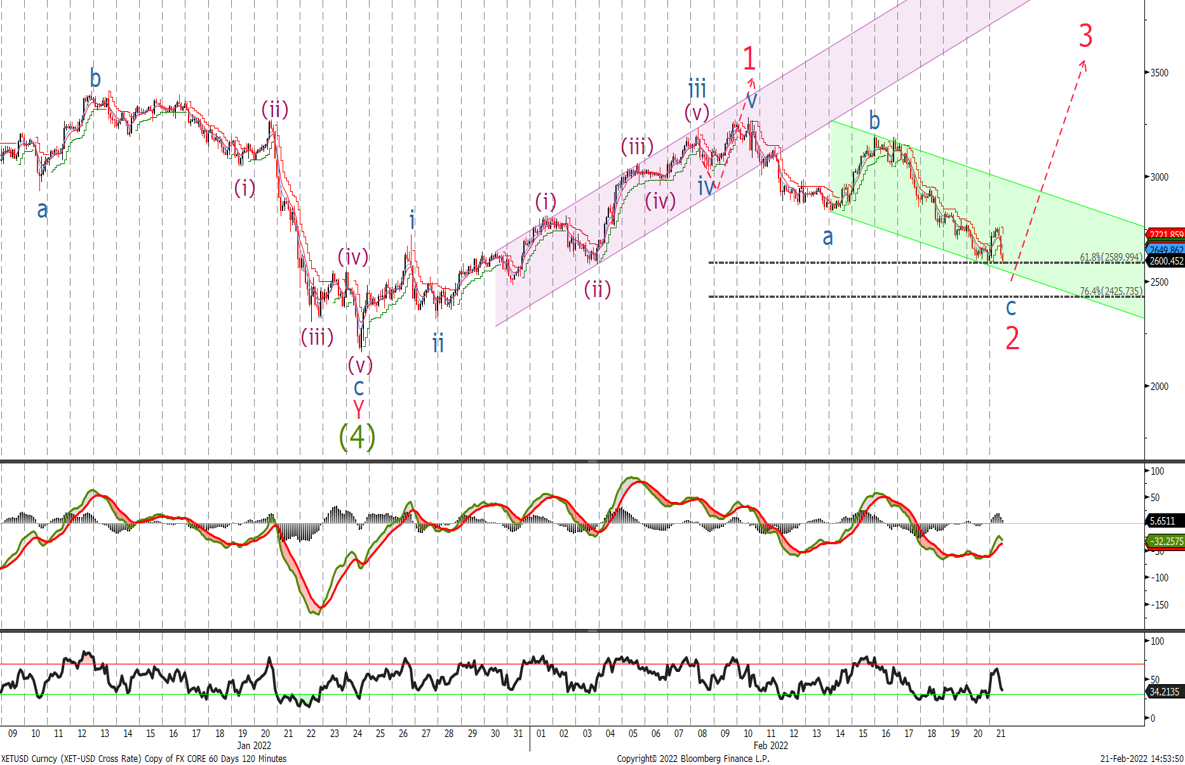
Ether Bullish Short-term Chart
Since we have sold-off in 3 waves, it is possible (if we have seen the end of wave (4) in January), that a correction should soon be over and wave 3 higher will soon be underway. This is the bullish view that I would say becomes the preferred count on a move above $3'200.
We said last week:
'A break below $2'722 will be the first indication that the bearish view is the more dominant idea with confirmation that ETH is going lower on a break below $2'316.’
As we haven't broken that level, the view remains bullish. On a risk reward basis, I would look to buy now at $2'590 and add at $2'425 with stops below $2'316.
By Matthew Clark
