
Bitcoin
Bitcoin Long-Term Chart
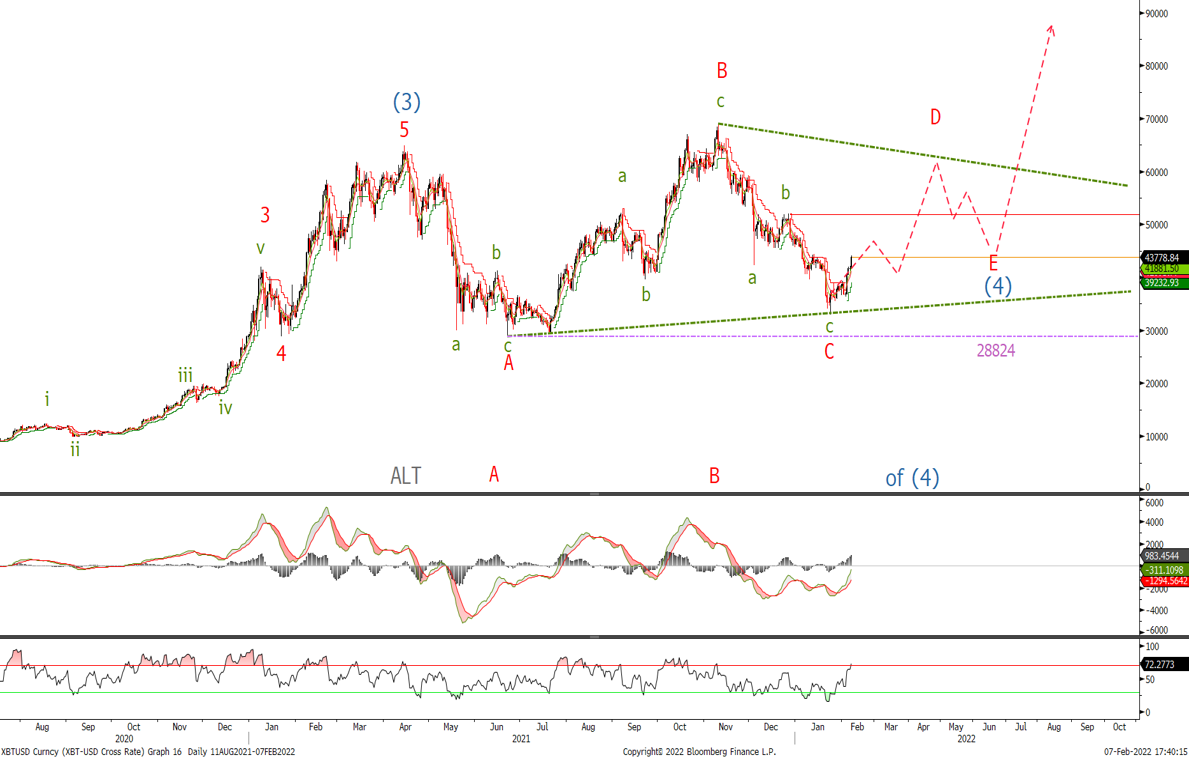
I have not touched the last alternate long-term view:
'Whilst above the wave A low at $28'824 and below $68'995 wave B high, one possible outcome for the BTC is that we trade in large triangle correction for the coming months. If this or the previous view is correct then we should see a nice recovery soon and place stops below the $28'824 which would negate them both. If wave D is underway we should see a 3 wave retracement into the 55/60k level. On a risk reward basis we should look to buy with stops below $28'824’
As you can see we have rallied nicely in 3 waves to today to a $44'110 high, therefore if wave D is underway, we should not break $28'824.
Bitcoin Short Term Chart
Last week we said:
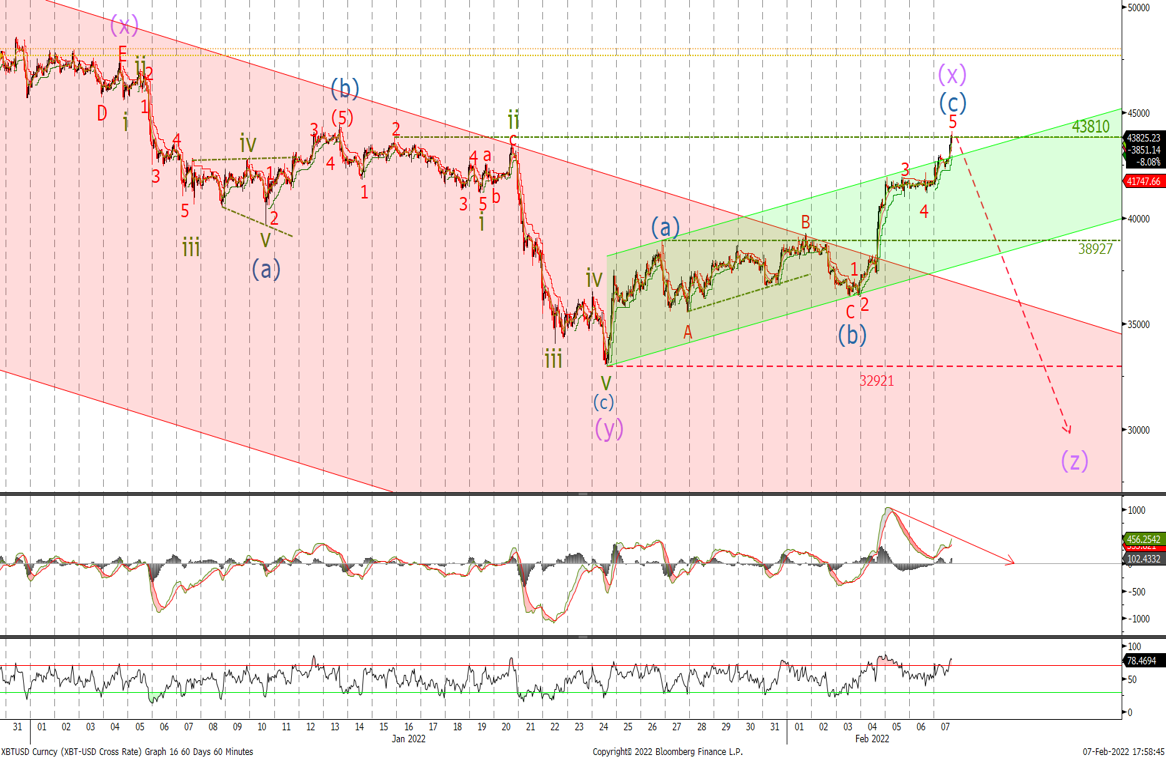
‘I would rather wait for a move above $36'524 to confirm a low is in place and use the recent low at $32'921 as a stop level’
The break out of the channel adds weight to the argument on the previous long term chart that wave C is in place. However for a zigzag correction we would need to turn from current levels of resistance that can be seen going back to the start of the year. We can count 5 waves up, therefore this coming sell-off will add clarity. A move below $38'927 would add weight to the view of this chart and as mentioned last week
'take the form of a zigzag to new lows below $29'000 to complete the larger wave (4)'
It will take a move above $69k to confirm Bitcoin's bullish trend has resumed. Closed long at current levels or raise stops to $38'927 or $35'450.
Ether
Ether Bearish Long Term Chart
The move lower we were looking for failed to materalise, which makes for both bullish and bearish arguments at this point.
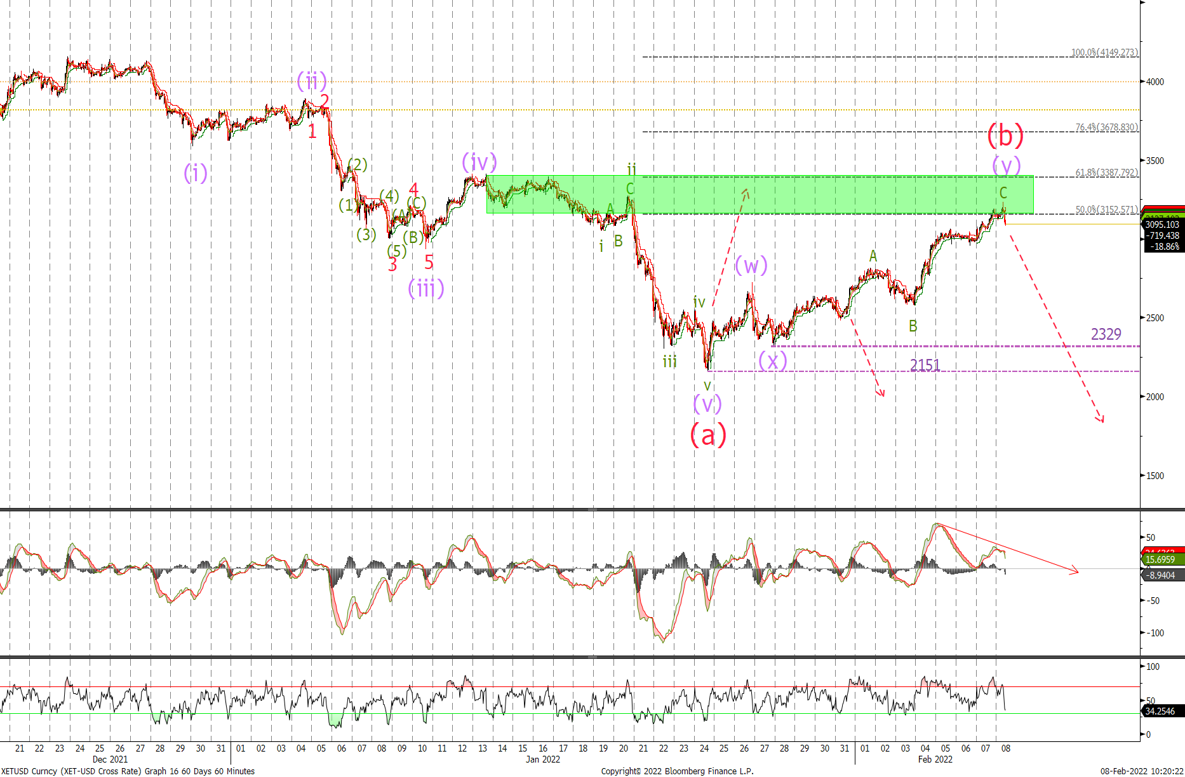
Here we are showing the longer term ETH chart and possible wave count that calls for a sell-off from current levels as we retrace into the area of the previous wave (iv) and the 50%-61.8% area. Lets look at the next short term chart to see the count up from the January lows.
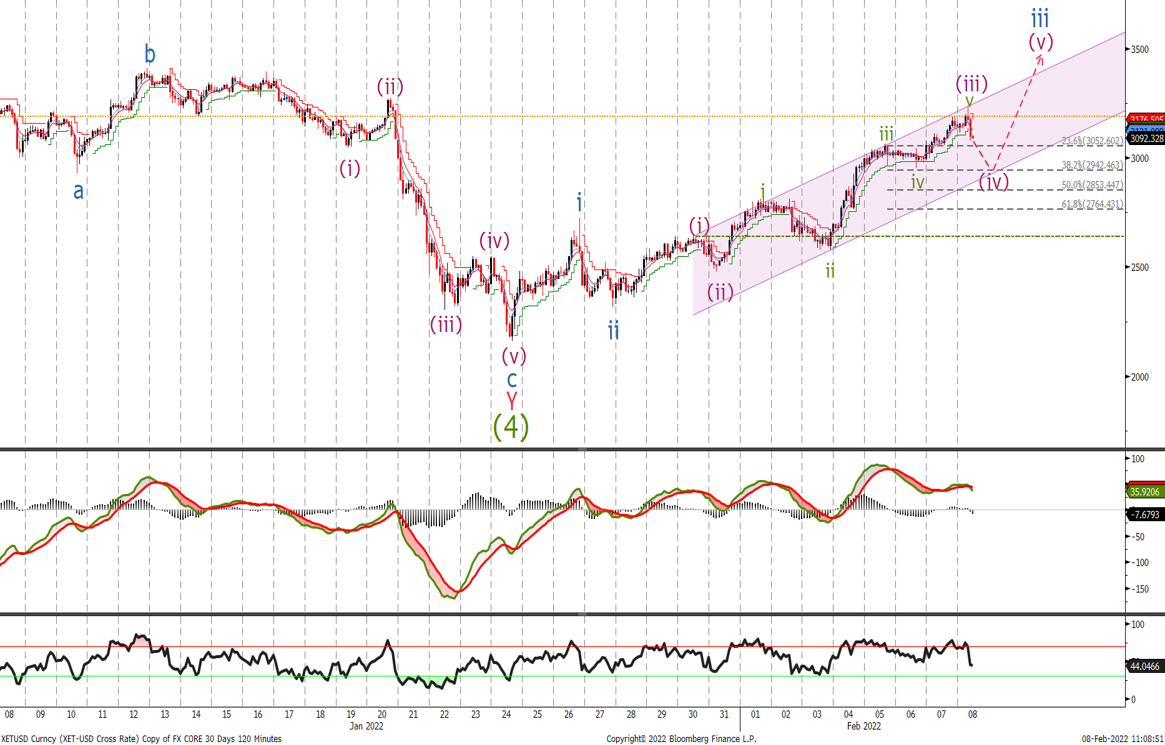
Ether Bearish Short Term Chart
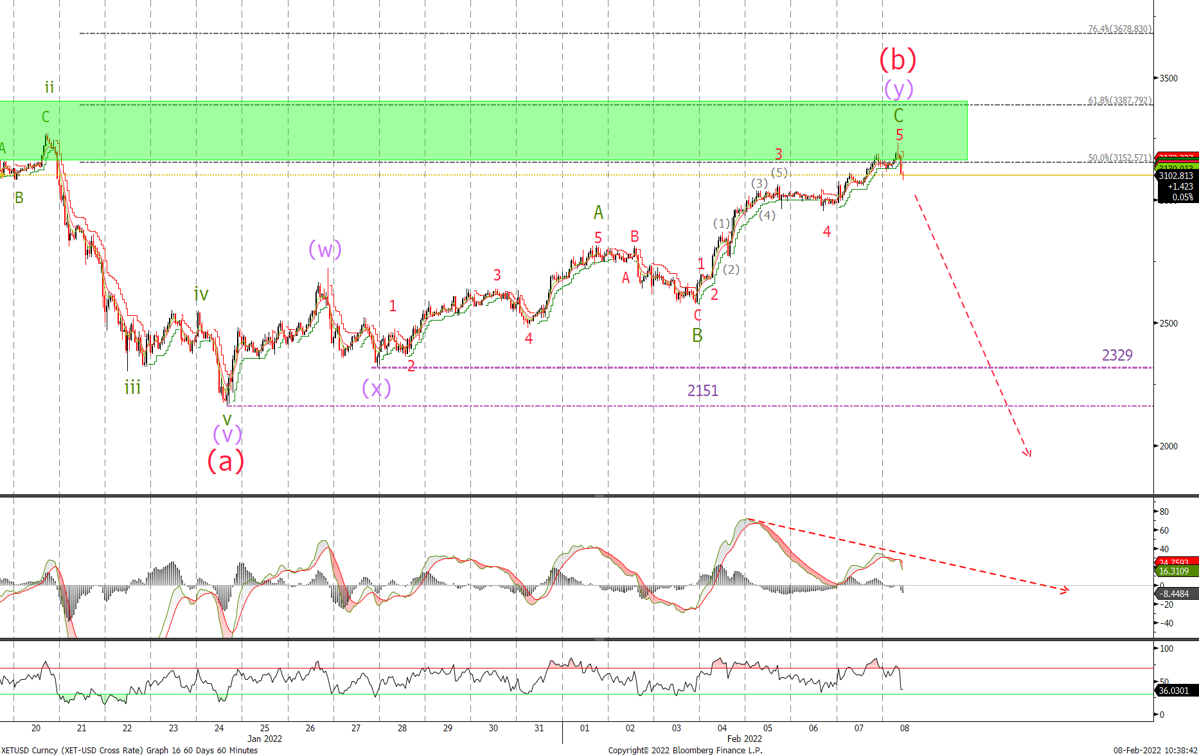
Looking at the short-term chart, which ever long-term view turns out correct, given the divergence in the MACD, I am looking for ETH to sell off from these highs. Near term price action will determine the direction of the market for the next few weeks.
A move below $3'050 will be the first indication a top is in place, followed by $2'950. Confirmation that the more bearish view is in play will be a close below $2'570 followed by the wave (x) low at $2'329.
Ether Bullish Chart
This is the bullish view that I would say becomes the preferred count on a move above $4'150. Given the divergence on the MACD we are looking for a correction towards the bottom of the channel to complete wave (iv) before a push higher to complete wave iii. A break below $2'722 will be the first indication that the bearish view is the more dominant idea with confirmation that ETH is going lower on a break below $2'316.
Written by Matthew Clark
