
Bitcoin
Long Term Chart
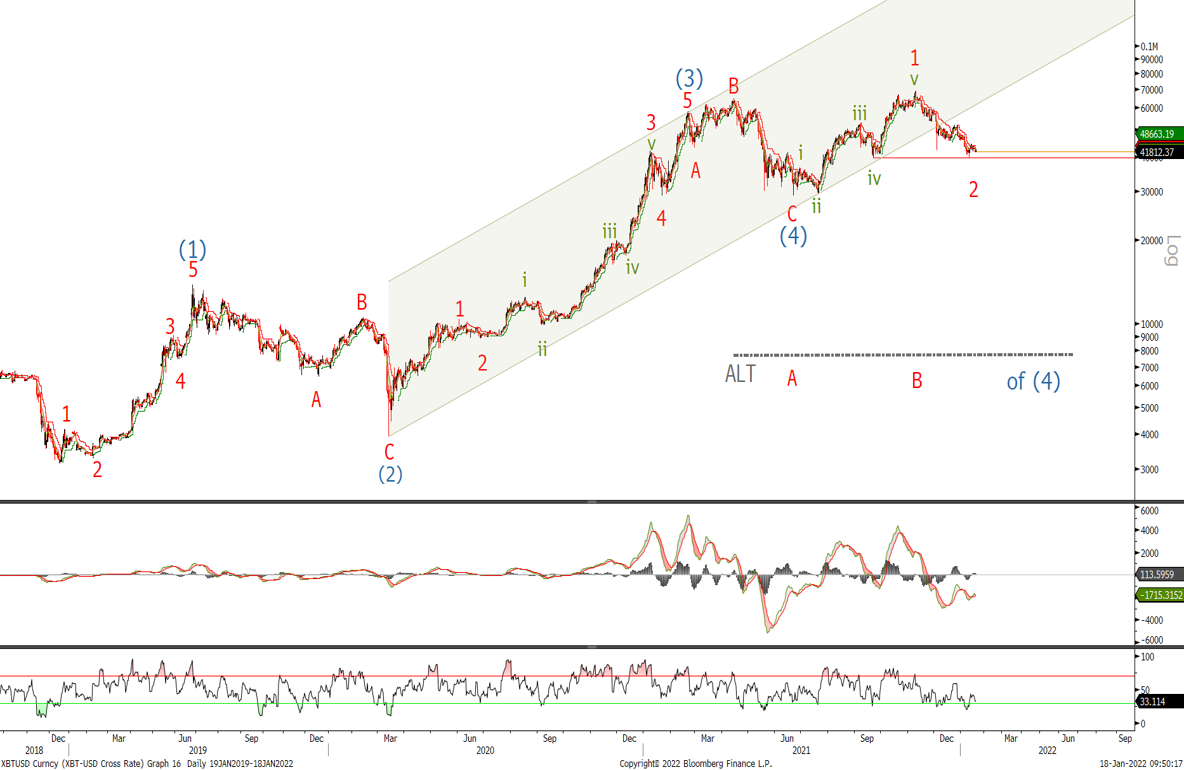
I am showing the long term logarithmic chart of Bitcoin going back to the start of this leg higher. We are looking for a low to occur soon to complete the wave 2 correction which should find support around the previous wave iv at $39'620.
We tested the $39'663 area earlier this month and whilst above there we will look for it to trade higher.
I would like to bring your attention to the alternative scenario which calls for a larger wave (4) correction that could take the form of a triangle (often seen in a wave 4) that could see us trade in a large sideways pattern for the year or take the form of a zigzag to new lows below $29'000 to complete the larger wave (4).
However at this point we remain bullish and will look to the shorter term charts for timings.
Short Term Chart
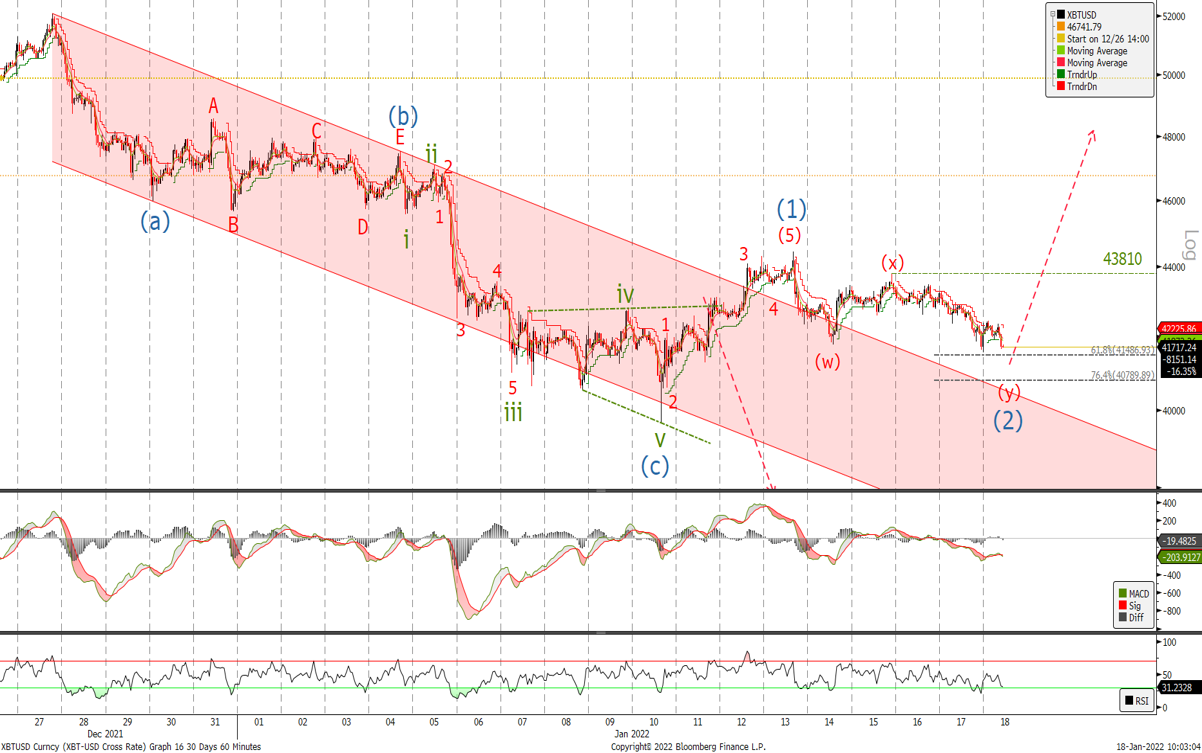
We haven’t broken the $47'500 level we were looking for in the short term to confirm the larger bullish trend has resumed. But the break out of the channel in 5 waves means at current levels we are looking for it higher whilst we trade above this year's low at $39'663. Look to buy at the 61.8% retracement level at $41'900 and again at $40'800 with stops at $39'633.
Ether
Long Term Chart
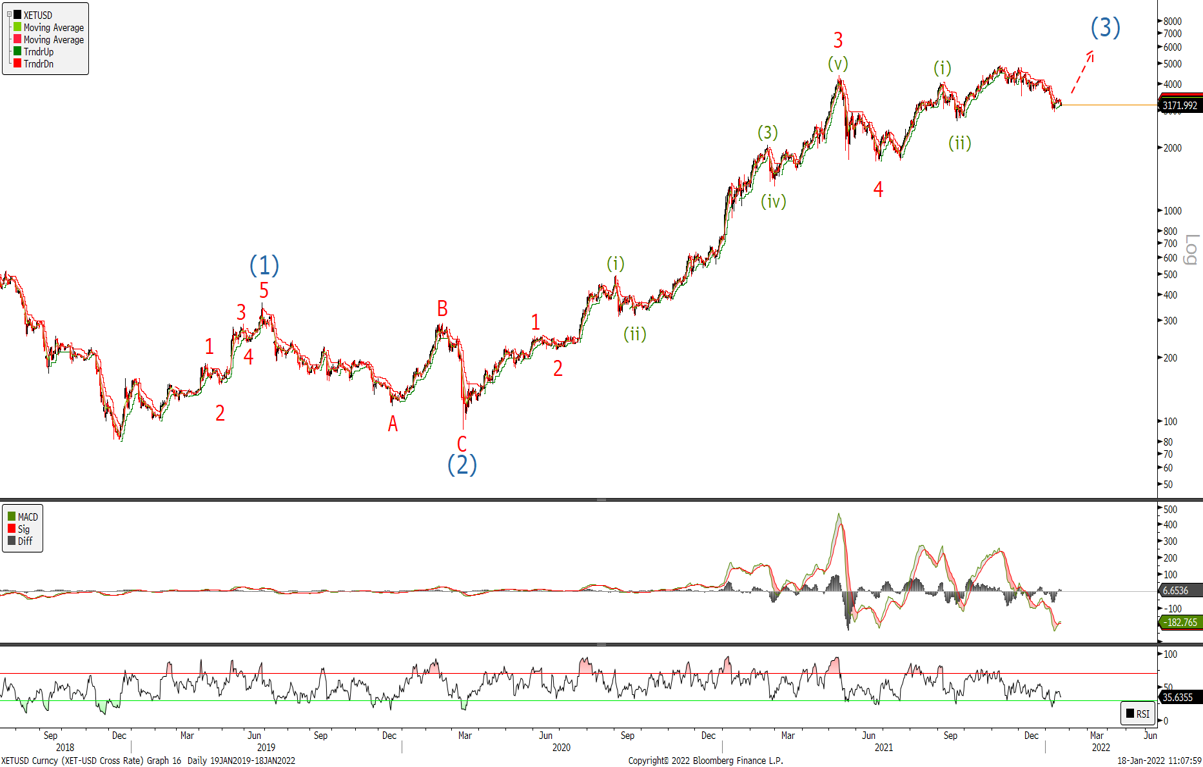
The long term logarithmic chart for Ether shows a similar pattern to BTC. Whilst above $2'600 we will look for ETH to trade higher. A break below could indicate a test of the $1'700 level but lets look at the short term chart to see if the correction off the November highs is in place.
Short Term Chart
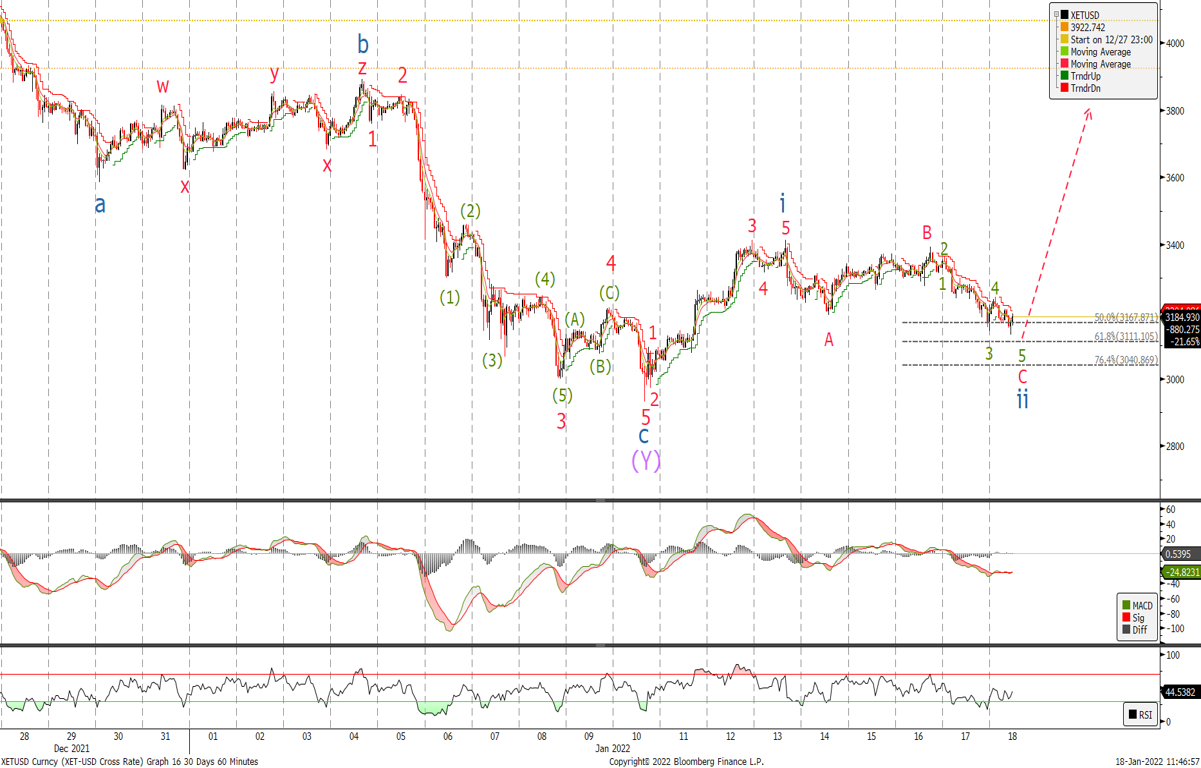
Looking at the short term chart we have completed or are close to completing the wave ii correction and look to buy in the $3'040 / $3'140 area where several retracements are situated. A break of $2'900 will negate the view but I will remain bullish until we break the longer term support level at $2'600.
Written by Matthew Clark
