
Bitcoin
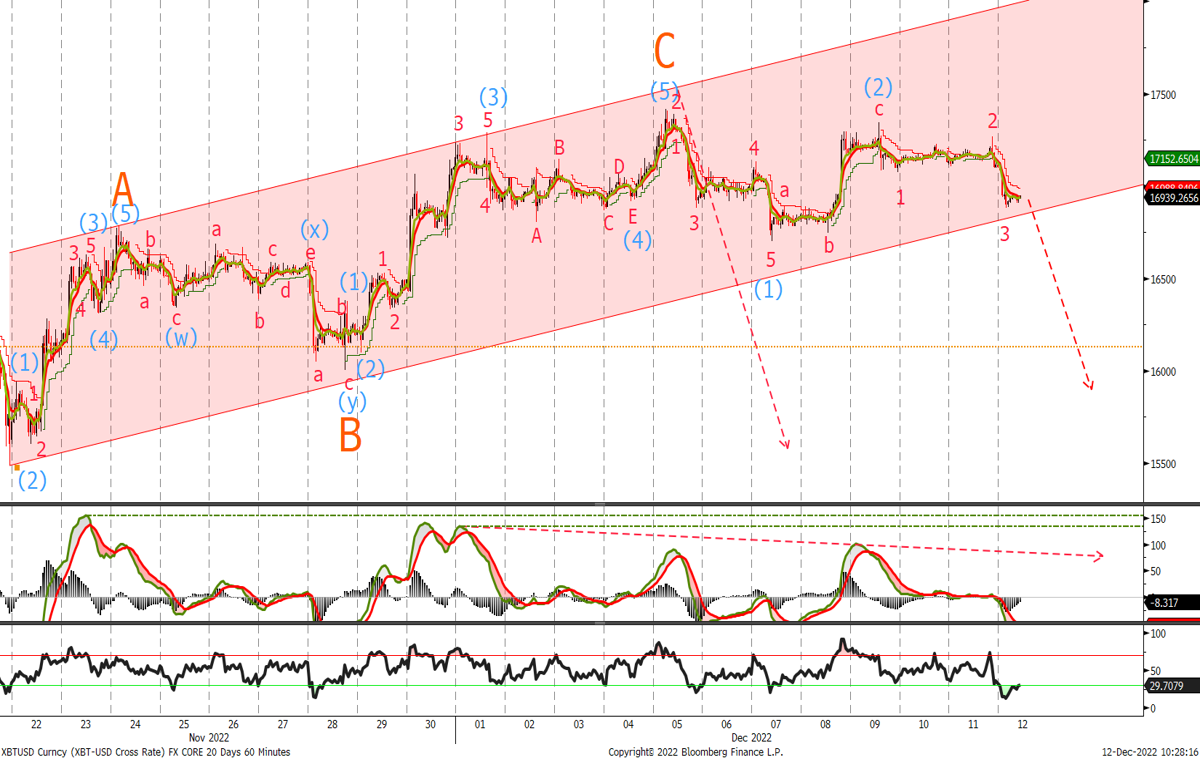
Last time we said
‘If the bearish view is valid then a correction in 3 waves is close to completing with a possible push to 17530 which would test the top of the channel as well as the 161.8% retracement level. Given the divergence in the MACD we expect a top to be in place soon with a close below the 15995 level indicating what should be the final leg lower to new lows.’
We traded to 17431 before selling off, we remain bearish whilst below 18200 we remain bearish. Look for an acceleration to the downside on an hourly close out of the channel and below 16670.
Ethereum
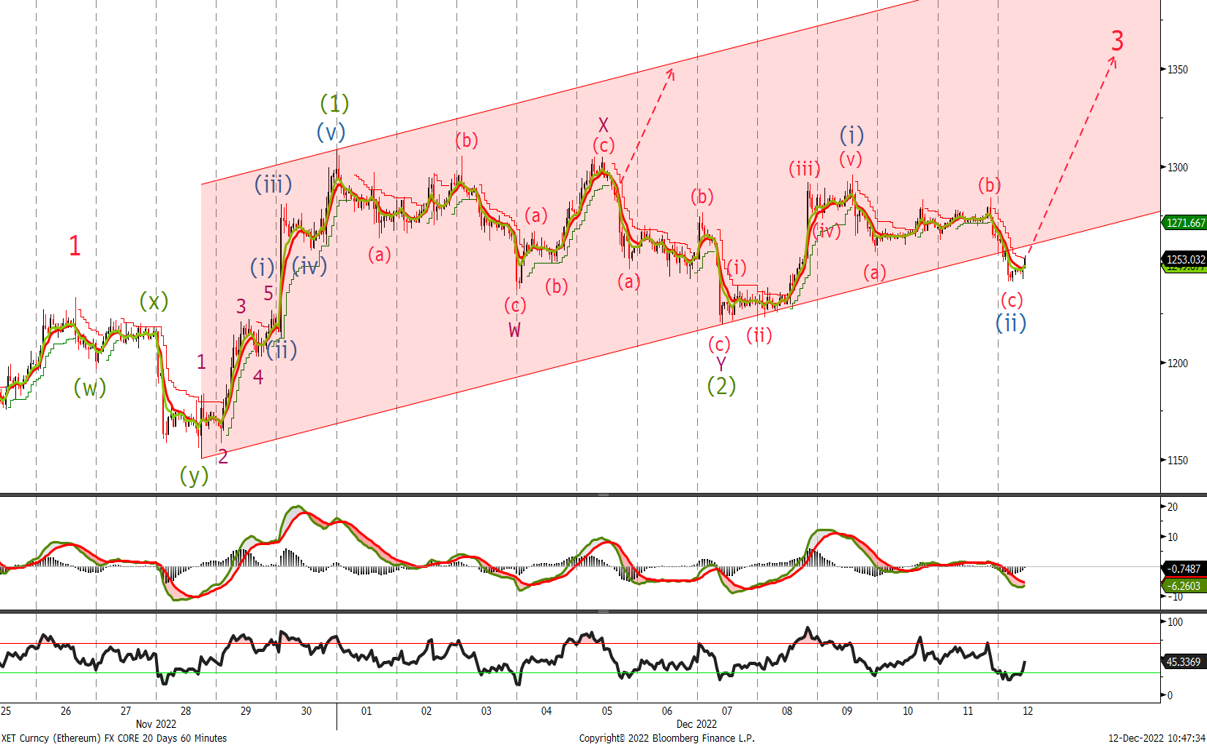
Last time we said
‘A close above 1350 on a daily basis will confirm that the next leg higher is underway. Until then given the set up for divergence in the MACD stay on alert for a possible sell off with a close below wave (2) at 1150 indicating another sell off ahead.’
No change in the view from last week with neither level mentioned above broken and the possibility a larger triangle correction is playing out as discussed last week.
