
Bitcoin
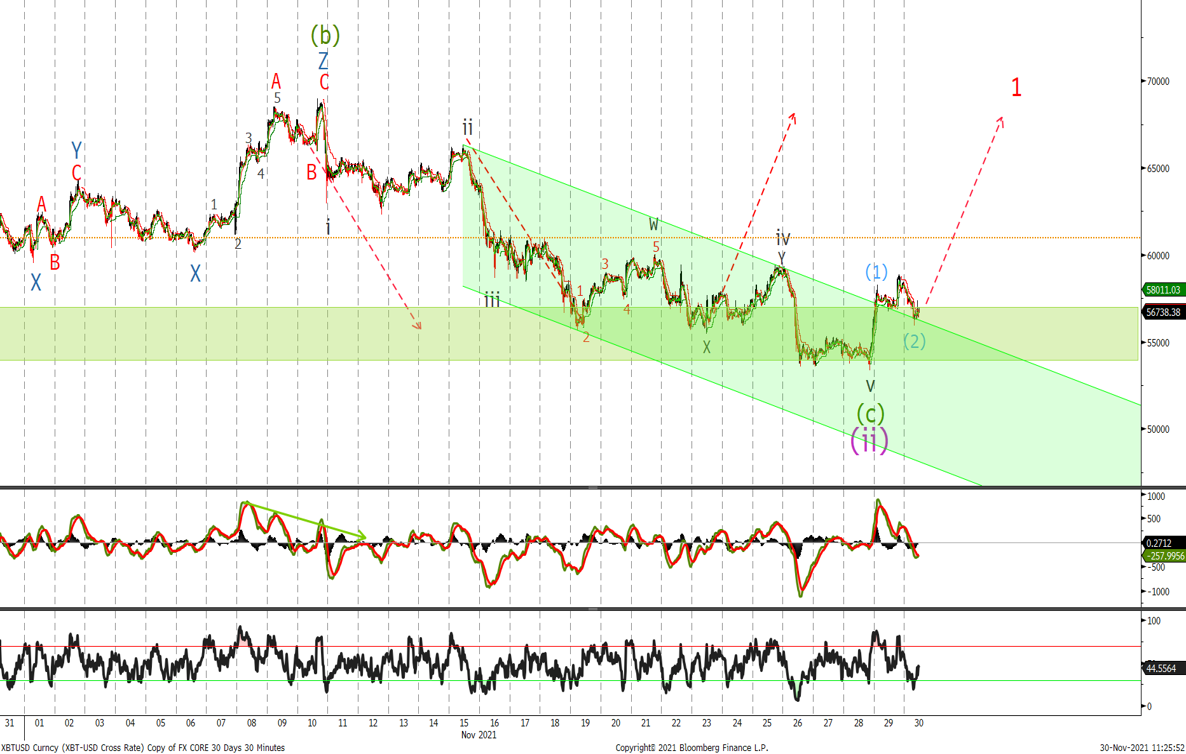
Last time we said:
‘Looking at the BTC has either ended or is very close to ending and we would start to accumulate a long position at current level, add at 54'800 and again at 54'300, with stops below 44'000 with a move back above 59'500 confirming that wave (3) is underway’
We traded to 59'434 before selling off to a low of 53'500, enabling us to be long at an average of 55'500. Leave stops at 44k for the next leg higher. In the short term any further dips look to add to long for the next leg higher with target above 72k.
Ethereum
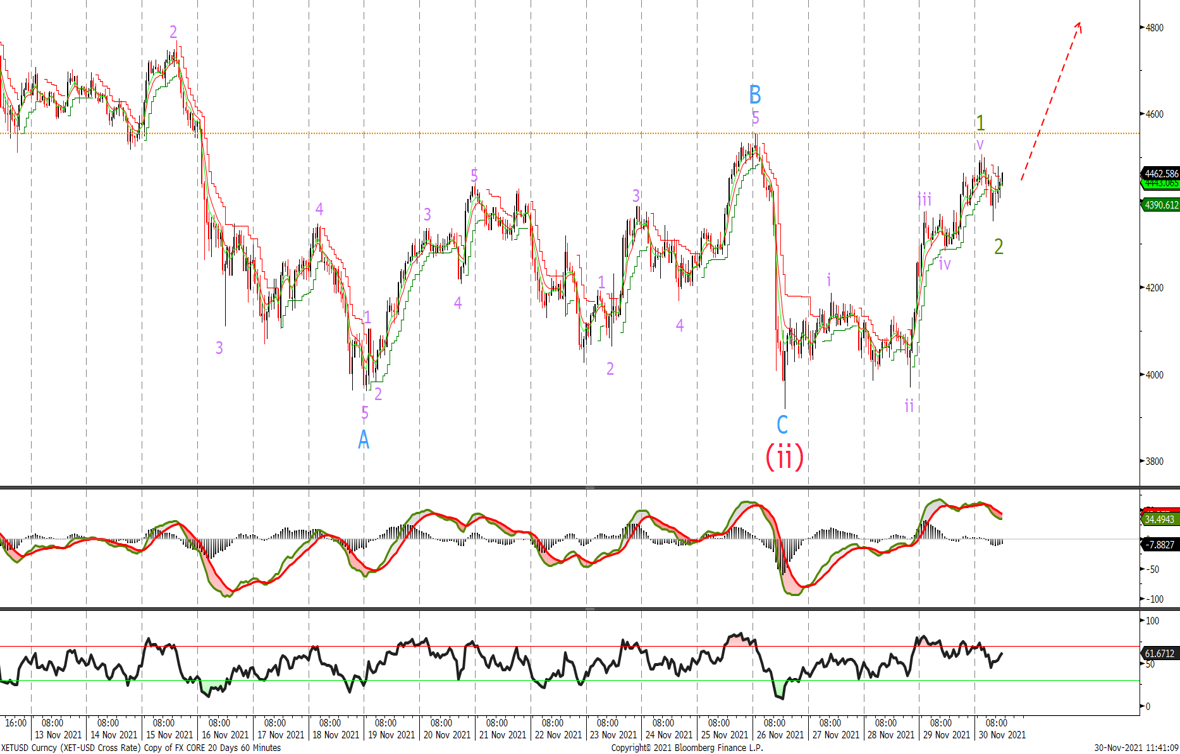
Last time we said:
‘Looking at the charts we traded down to 3'976 into our support zone and we are starting to build a long position. The divergence last week in the MACD add evidence that wave 3 is underway, although we do not rule out a new low we would use this as an opportunity to add to longs. Trading above 4'330 and an impulsive rally out of the channel will add weight that ETH is heading higher, raise stops to 3'416'
Remain long with a move above 4'555 targeting 4'750 resistance area. Until then there is a possibility that ETH hasn’t finished its wave (ii) correction and a break of last week low will confirm this so I would place stops below with the opportunity to buy them back cheaper. I will update charts if this scenario plays out until then buy on dips with stops below 3'900.
Written by Matthew Clark
