
Bitcoin
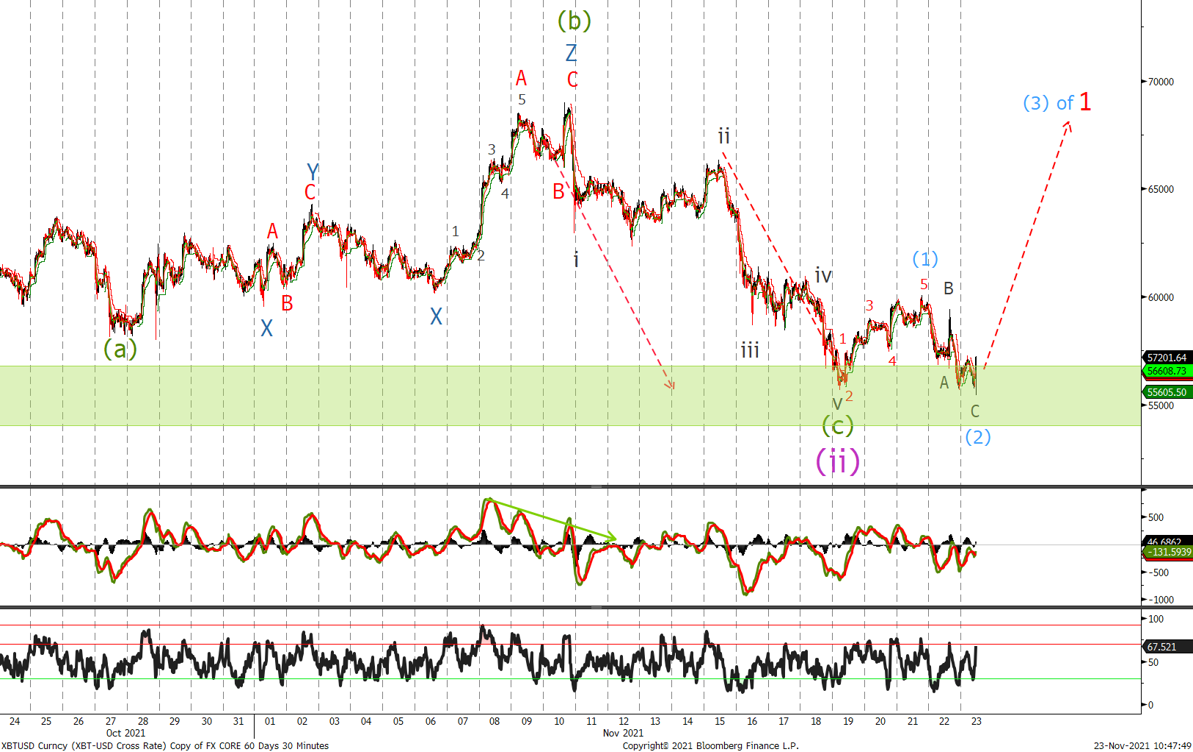
Last time we were looking for the correction to end in the green area of support and evidence that that the wave (ii) has ended. Looking at the BTC has either ended or is very close to ending and we would start to accumulate a long position at current level, add at 54'800 and again at 54'300, with stops below 44'000. Looking at the divergence in momentum, I expect a sharp reversal higher at any time and a move back above 59'500 confirms that wave (3) is underway.
Ether
Last time we said:
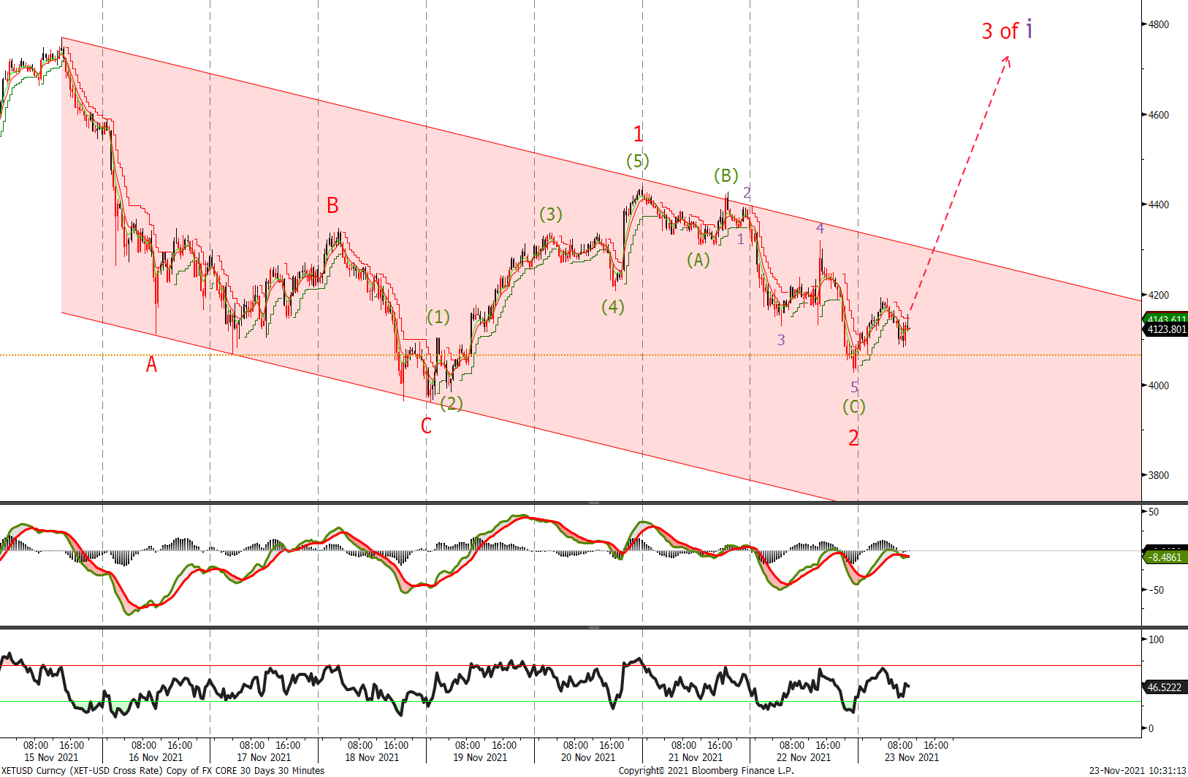
‘once wave 1 completes we will be on the look out for a 3 wave correction to the downside with support expected in the 3770-3995 area. We would use this opportunity to buy more ETH'
Looking at the charts we traded down to 3'976 into our support zone and we are starting to build a long position. The divergence last week in the MACD adds evidence that wave 3 is underway. Although we do not rule out a new low we would use this as an opportunity to add to longs. Trading above 4'330 and an impulsive rally out of the channel will add weight that ETH is heading higher, and raise stops to 3'416.
Written by Matthew Clark
