
Bitcoin

Last time was said:
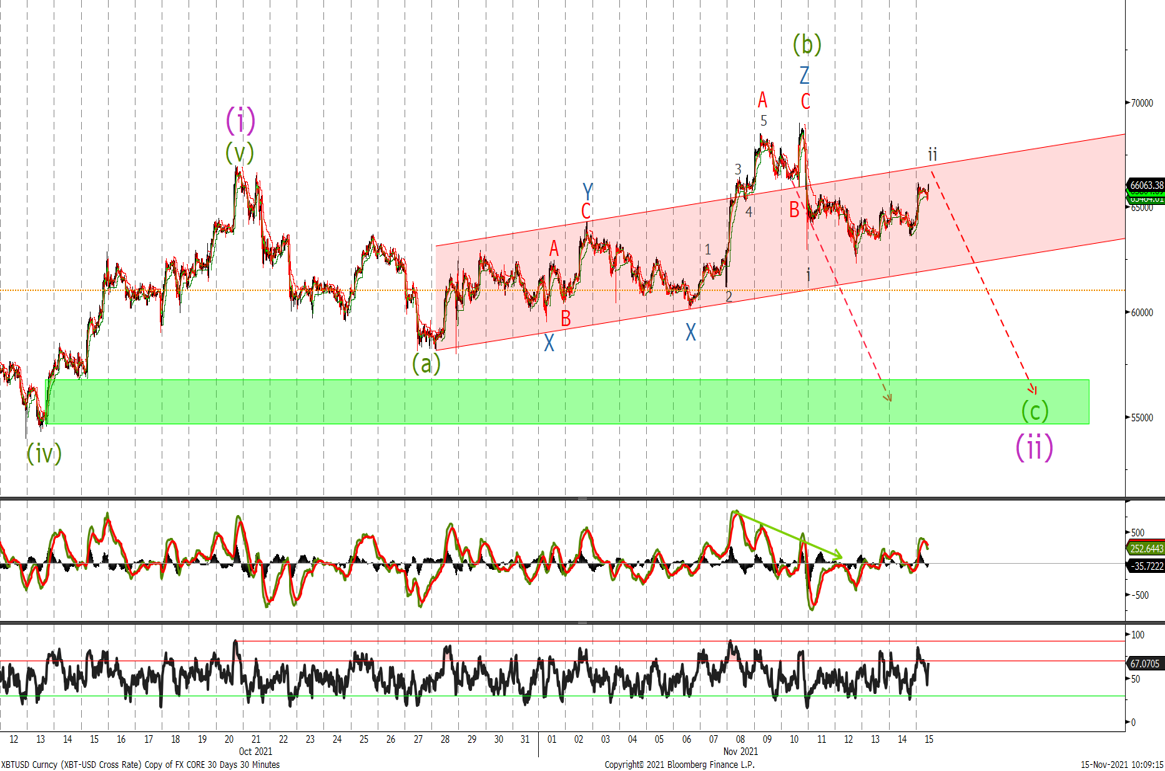
‘We can count 5 waves up since the wave 4 low and a move back through 65'200 should see an acceleration to the downside. I am sticking with an expected correction lower with daily momentum showing bearish divergence. Once we break the wave X low, we target the area of the previous wave (iv). And would look to start buying for the next major impulsive wave (iii) higher.’
The sell off from the 68k high to 65k was sharp and indicates that the next leg of the correction is underway. I would look to sell towards the 66'500 level looking to rebuy in the green target zone.
Ether
Last time we said:
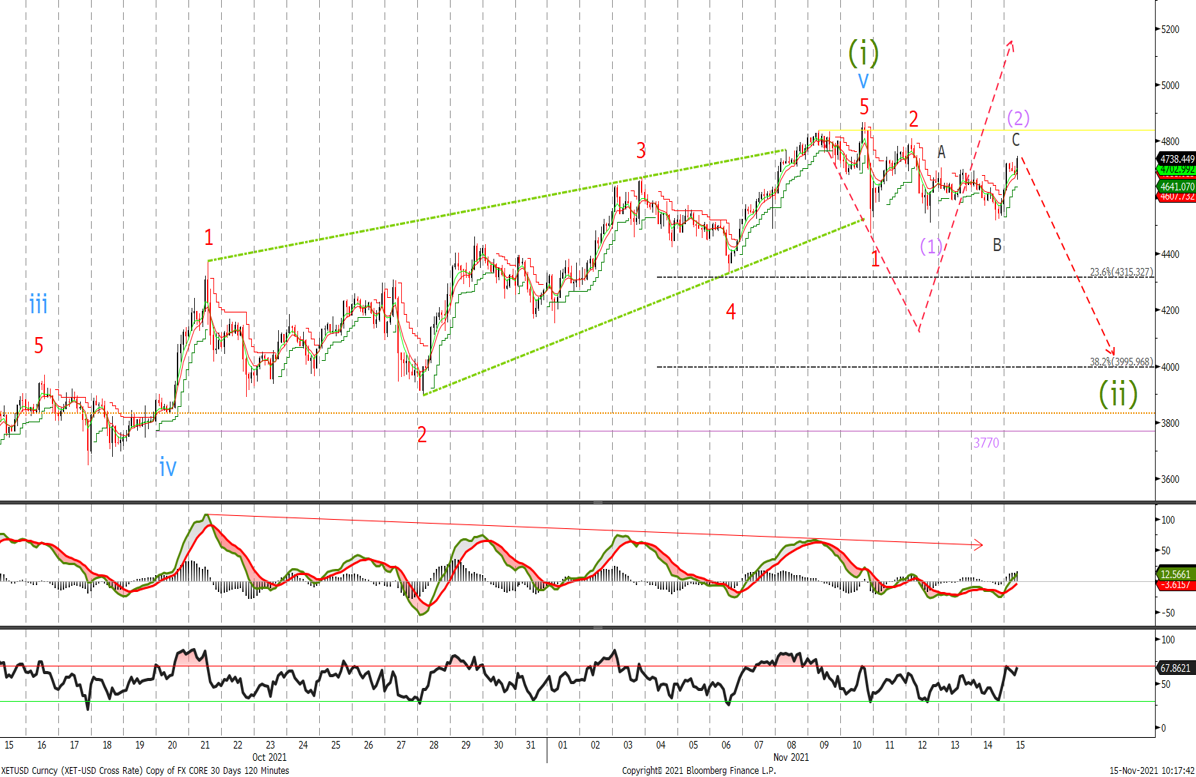
‘Given a similar divergence pattern in the momentum indicators to BTC, I would start to lighten up on the position as I can now count 5 waves up. It does not mean that we will finish wave (i) immediately with possible targets to the topside at 5'062 and 5'155. Once wave (i) completes we will be on the look out for a 3 wave correction to the downside with support expected in the 3'770-3'995 area. We would use this opportunity to buy more ETH.’
We traded just 26 points higher since my last update and whilst we trade below 4'870 we look for the correction to unfold.
Written by Matthew Clark
