
Bitcoin
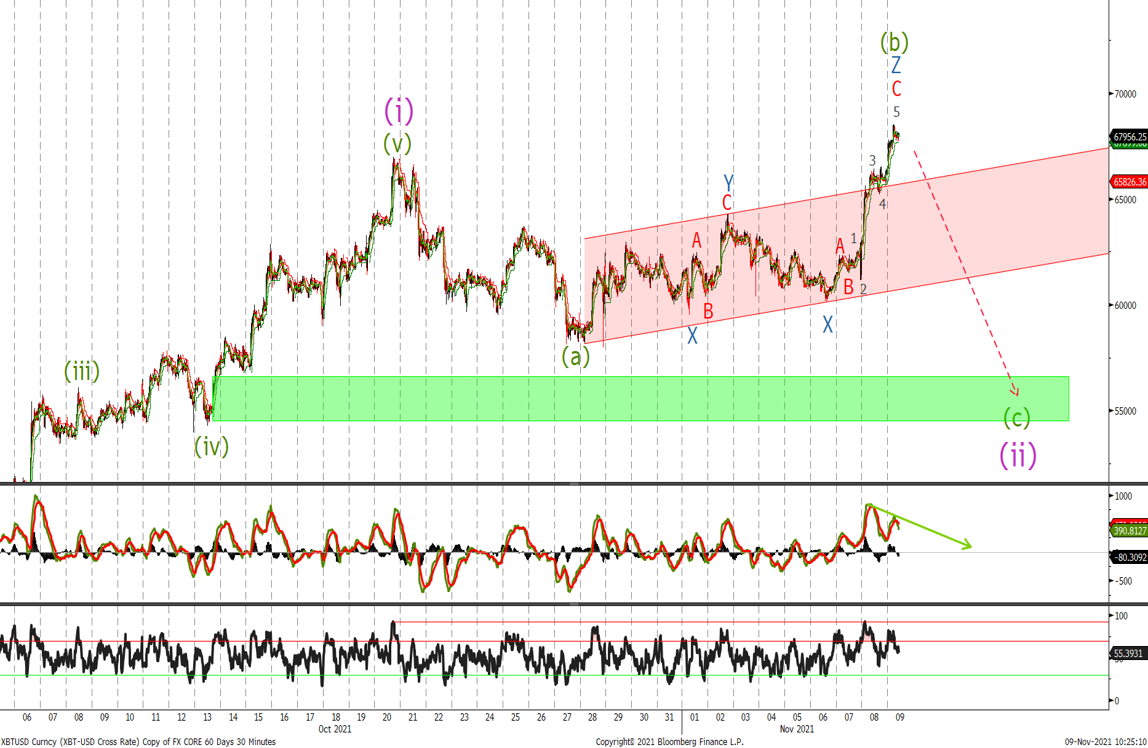

The move above 63'706 indicated that a larger corrective triangle is underway. We can count 5 waves up since the wave 4 low and a move back through 65'200 should see an acceleration to the down side.
I am sticking with an expected correction lower with daily momentum showing bearish divergence, highlighting that this breakout should soon run its course. Once we break the wave X low we target the area of the previous wave (iv). And would look to start buying for the next major impulsive wave (iii) higher.
Ethereum
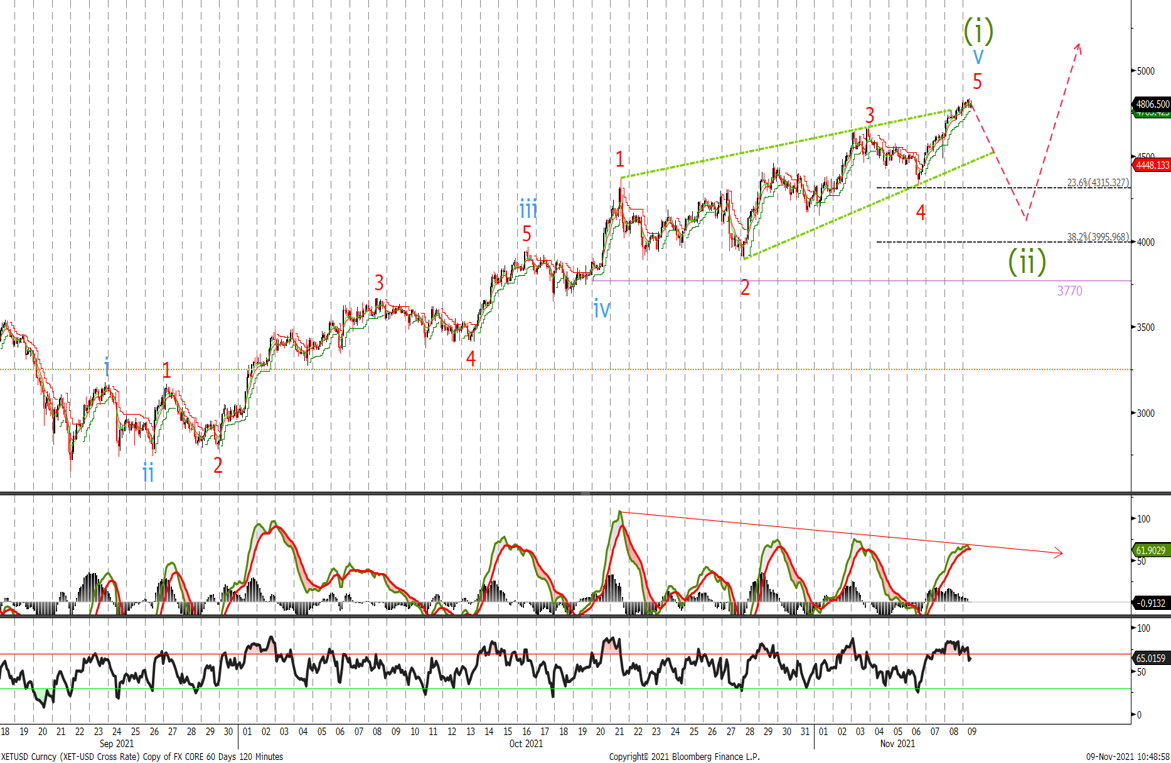
Last time we said:
‘Look to sell position on a test of the channel high around the 5k level’.
Given a similar divergence pattern in the momentum indicators to BTC, I would start to lighten up on the position as I can now count 5 waves up. It does not mean that we will finish wave (i) immediately with possible targets to the topside at 5'062 and 5'155.
Once wave (i) completes we will be on the look out for a 3 wave correction to the downside with support expected in the 3770-3995 area. We would use this opportunity to buy more ETH.
Written by Matthew Clark
