
Bitcoin
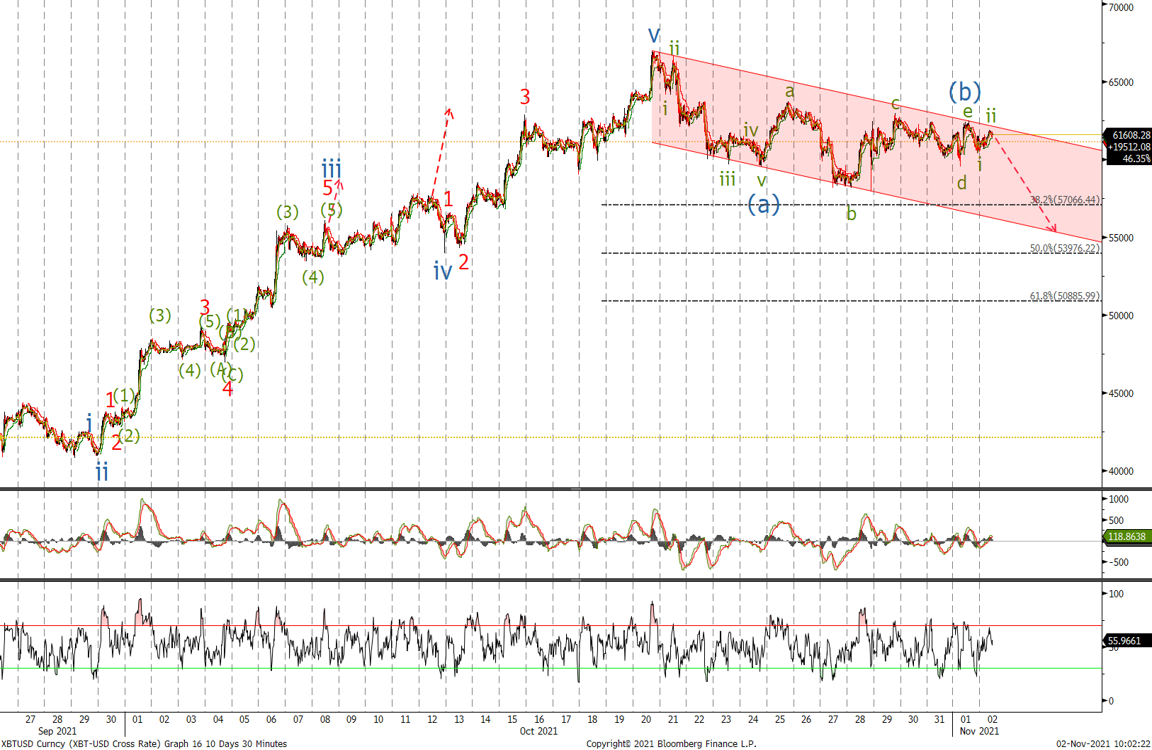

Last time we were looking for higher with
Target to the topside are now 65'320 followed by the top of the channel and 67'700, where wave v is equal in length to wave iii.
The high registered at 66'976 to complete the first wave higher and since then we have traded in a large range which I am interpreting as a corrective triangle that should see another leg down towards the bottom of the channel. I would look to rebuy BTC at 57k and at the 50% retracement level at 54k. A move above 63'706 will indicate a large zigzag correction that is underway and will take a move above 66'678 to turn me more bullish.
Ethereum
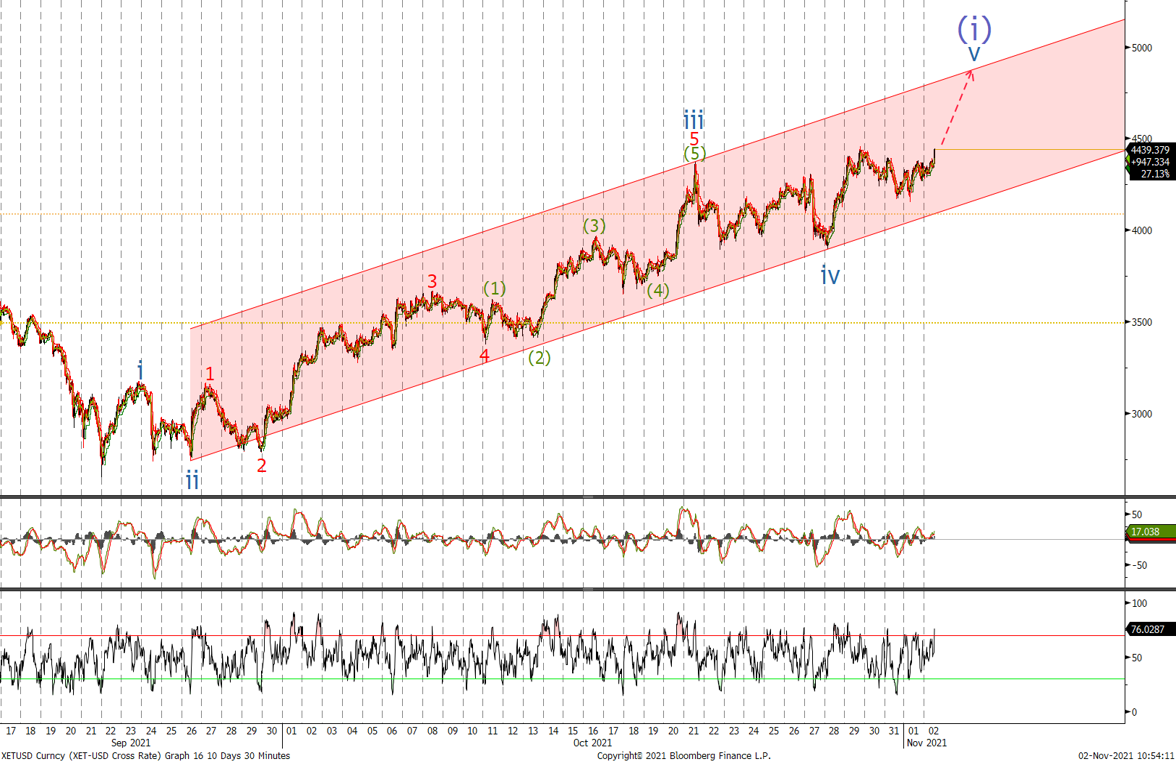
We still remain long following the last update where
'If wave 2 has completed then we should see an impulsive move above 3'895 and an acceleration towards the top of the channel. Where I would start to reduce the position.’
This morning price action looks as if we are going to make new highs to complete the 5 waves up for wave (i). Once in place we should see a correction back to the 4'000 level possibly 3'600 which would provide another buying opportunity. Look to sell position on a test of the channel high around the 5k level.
Written by Matthew Clark
