
Bitcoin
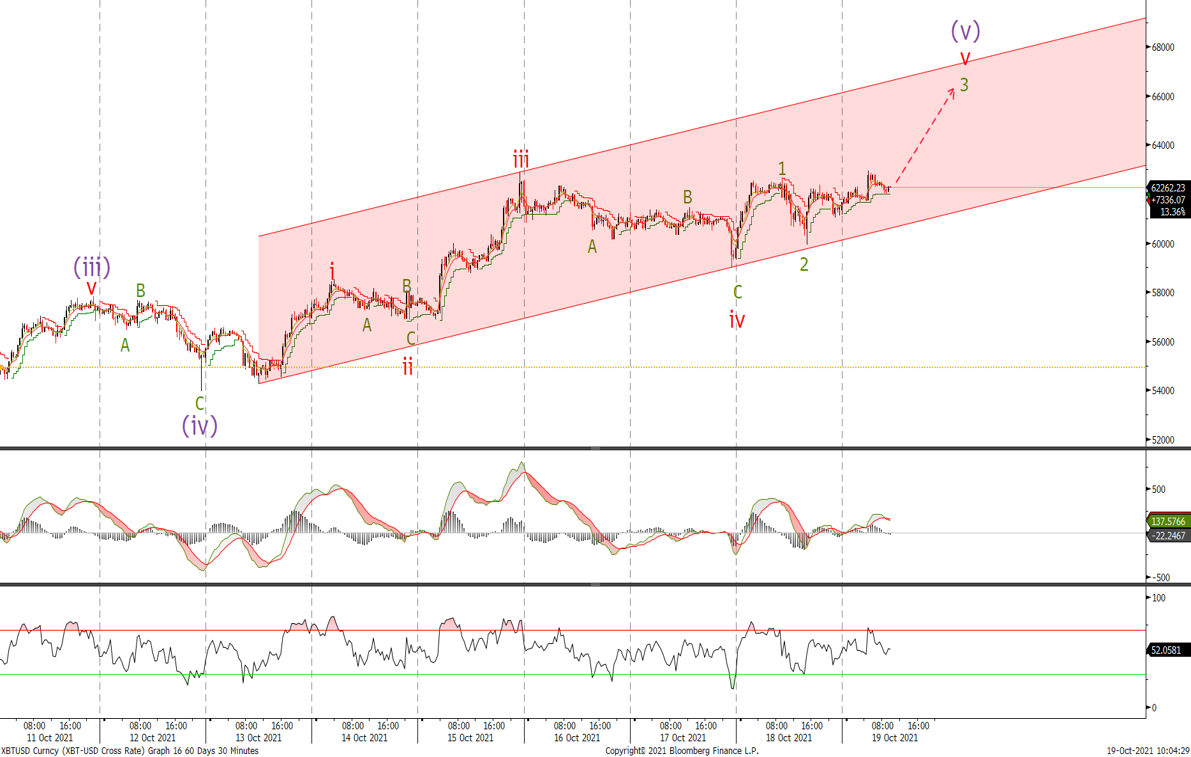
Last time we were looking for higher with ‘target to the topside is 63'613 and this move could be sharply higher to new highs above 65'000.’ We have stopped so far just shy of the 63'000 level and looking at the chart of the last leg up, it looks as if we should keep trading higher in 5 waves. Remain long and look to add around the 59'200 level with stops below last weeks low. Target to the topside are now 65'320 followed by the top of the channel and 67'700 , where wave v is equal in length to wave iii.
Ethereum
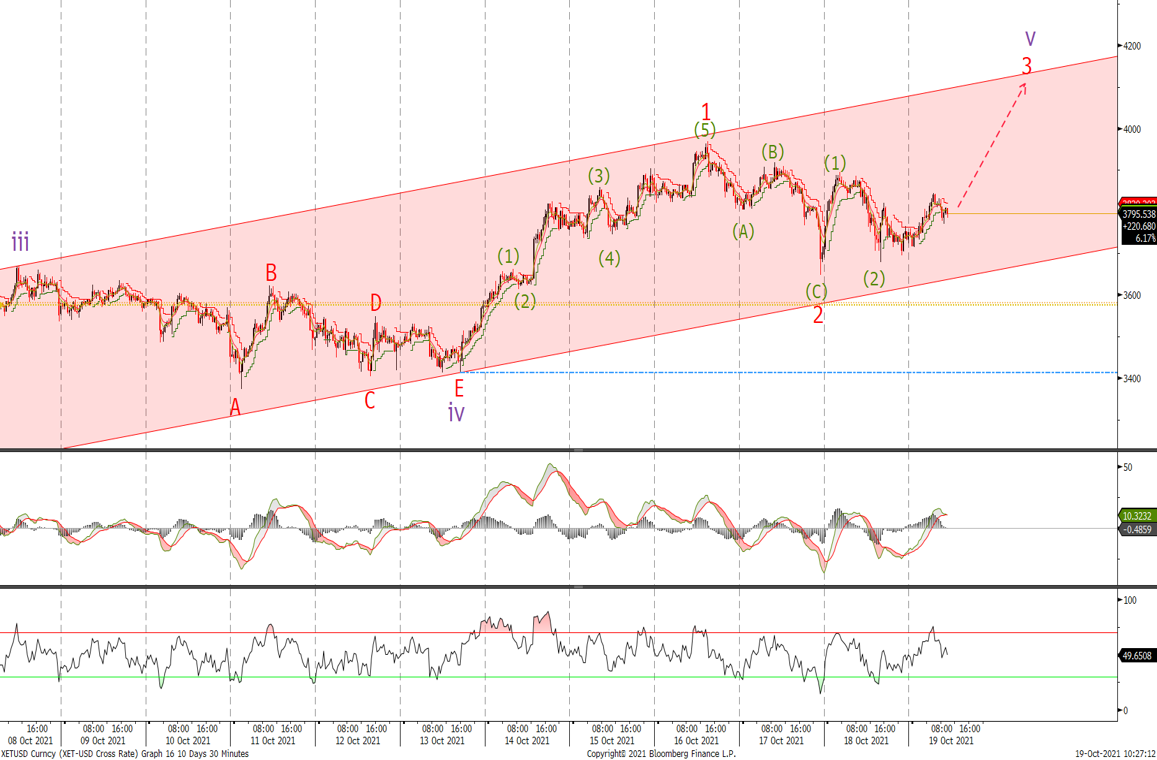
We remain long at 3'323 and after last week at ‘With an initial target at 3'897 followed by 4'024 and the top of the channel.’ As you can see we traded just shy of the channel top at 3'969. If wave 2 has completed then we should see an impulsive move above 3'895 and an acceleration towards the top of the channel, where I would start to reduce the position.
Written by Matthew Clark
